To fully understand the Snap4City Architecture and tools we suggest to read the document reporting the TECHNICAL OVERVIEW: https://www.snap4city.org/download/video/Snap4City-PlatformOverview.pdf which also includes a glossary of terms (take in mind the change of terminology as reported in Section 1). On the other hand, a summary is reported in this section for shortening your learning and training.
Snap4City platform is 100% open source, scalable, and modular with a set of tools accessible according to user profiles. Smart Applications can be easily developed by producing only: data transformation, data analytics and dashboards with almost no coding activities.
Snap4City can ingest and process/produce data/entities of any domain according to any kind of data sources: GIS (ArcGIS, QGIS, etc.), city utilities (water, gas, mobility, energy, light, water, environment, industry, etc.), legacy systems, personal data, mobile data, database data, IoT Network and Broker, brokers of any kind, KPI/MyKPI, Industry 4.0 protocols and network, social media, telecom data, trajectories, heatmaps, flow, origin destination matrices, satellite data, etc. All sources are bidirectional channels as Snap4City can ingest and produce data/entities with protocols suitable for any channel. See for interoperability https://www.snap4city.org/65.
Snap4City supports any kind of data flow Entity Networks, communication protocols, and entity/data formats, as well as any legacy and vendor solution. Entity/Data Ingested with any data/entity model are aggregated on the basis of Km4City Ontology into the so-called Knowledge Base (which is the Expert System of the city/industry) and into the Big Data storage, NoSQL. This approach eliminated the problems of data silos and pillars. Any legacy solution, as well as new applications and data/entity is integrated in a unified model, establishing semantic relationships of any kind and respecting the original semantic, thus avoiding the flatness of data lake that results in poor performance in data/information access when needed for rendering.
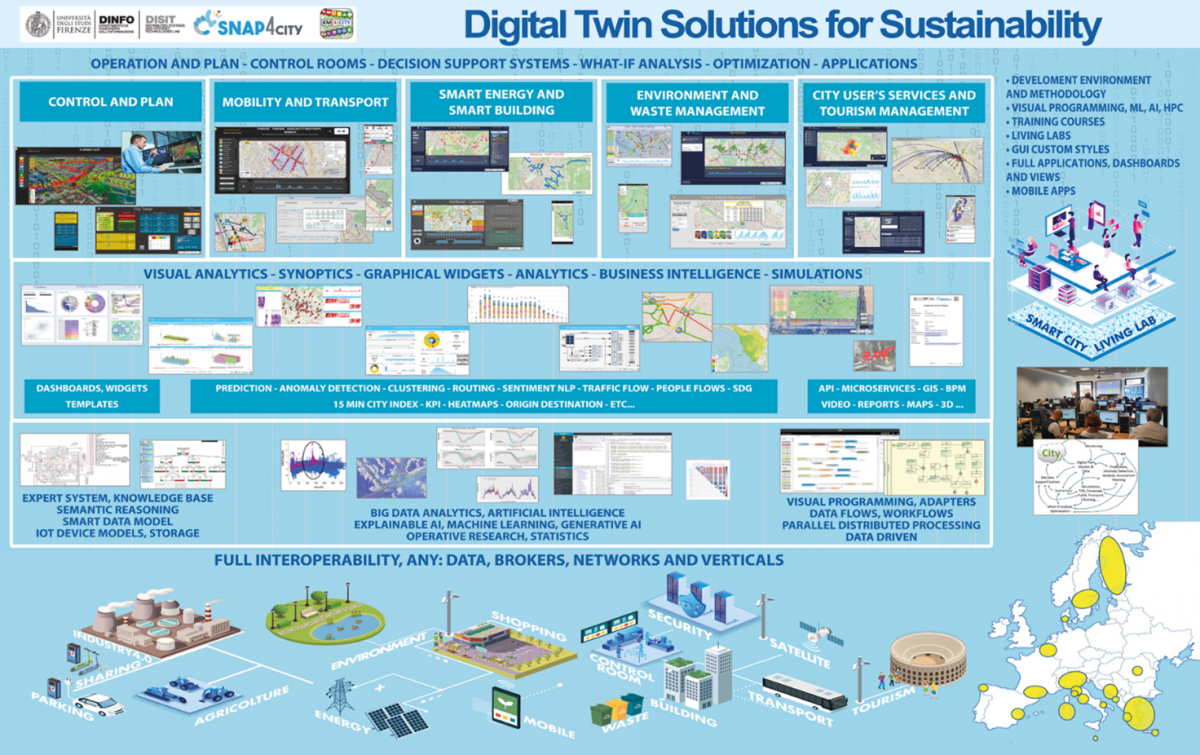
Figure: Global Architecture of Snap4City solutions and framework
Ingested data, just provided in the Brokers are immediately indexed and stored into the long term storage, becoming searchable and usable for snap4City tools such as the Entity Inspector / Data Inspector, Big Data Analytics, Dashboards builder, Smart City APIs and thus for the Mobile Apps, and via MicroServices for processing Logic / IoT Applications (IoT Apps) which are implemented as Node-RED, used for ingestion, production, integrations, transformation, business logic, server side business logic and intelligence, etc. https://www.snap4city.org/download/video/course/di/ Data ingestion can be also performed with high performance processes written in Python (provided by Snap4City as configurable script), for example for fast loading historical data from other data base or formats.
Data/Entities can be consumed by data-analytics, Processing Logic / IoT App, mobile App, and Dashboards and Synoptics, third party applications via API and in real time streaming, the so-called data driven processes, and end-to-end secure (from the devices to dashboards, back and forwards directions).
Data Analytics can be developed in Python and RStudio, and the platform provide tools and guide to transform them in containers to be used into Processing Logic flow (IoT App) in Node-RED. https://www.snap4city.org/download/video/course/da/.
Data Rendering via Synoptics, Dashboards, tables, any kind of graphics widgets can be easily used just selecting the data and choosing the preferred graphical representation of data/entities among the several possible: time trends, maps, bars, multiseries, chords, OriginDestination (OD) maps, tables, heatmaps, trajectories, scenarios, paths, shapes, buttons, dimer, sliders, hierarchies, spidernet, donut, comparing trends, staked diagrams, barseries, custom animated elements, etc. https://www.snap4city.org/download/video/course/das/.
Developers and qualified operators on Snap4City platform can access the platform tools via web browser (without any installations on the local computers) to develop solutions and applications in the Snap4City collaborative environment exploiting Data Analytics, Dashboards, and Processing Logic / IoT Apps (for data ingestion, adaptation, transformation; business logic, data analytic management, etc.). Data Analytics developers can also develop their application on their local computer if they prefer.
Mobile App developers need a local development Environment depending on the target mobile devices. Final users can access to Snap4City services via Web and mobile devices, dashboards, synoptics, interfaces for digital signages, tables, panels, etc.
A Snap4City Living Lab allows stakeholders to collaborate for the production of smart solutions and to the innovation of the whole smart ecosystem. Snap4City provides a methodology for stimulating the innovation identifying the most relevant and effective changes and solutions according to a quadruple helix approach. A Living Lab with the web based Snap4City Development Environment provides a comprehensive set of tools for developers and stakeholders to implement data ingestion and processing flows, Data Analytics algorithms, Dashboards, Processing Logic / IoT App, Synoptics, Custom Widgets, and Web and Mobile Apps [BIgDataService2018].
Smart Applications can be easily developed exploiting the cloud infrastructure by producing only: Processing Logic / IoT App, Data Analytics and Dashboards with almost no coding activities. Orange parts of the next Figure are those usually developed, while all the rest is part of the provided microservices and infrastructure. Third party applications can dialog with the platform and each other, and can be integrated with the solutions via Smart API, or via Brokers or via Processing Logic / IoT App any protocols.
Third party applications can dialog with the solutions via:
- Smart City API, Swagger: https://www.km4city.org/swagger/external/
- Broker/IoT Brokers API, for example for NGSI context Broker, Entity/IoT Directory: https://www.km4city.org/swagger/external/?urls.primaryName=Orion%20Broker%20K1-K2%20Authentication%20API
- Processing Logic/IoT App any protocols: https://www.snap4city.org/65
- And they can also expose some specific API, custom made.
- Authentication and Authorization APIs.
Edge and Fog processing can be implemented by using Processing Logic / IoT App or other means (custom processes), and may have direct connection with Snap4City Microservices on cloud or locally installed features as local devices, local database, local dashboard, local html pages, etc. API can be those mentioned Smart City API, Broker API. For example, an Edge processing tools may be implemented with Raspberry Pi, windows, Arm, Linux, etc., in which Node-RED is native or can be installed and Snap4City library can be loaded/installed as well.
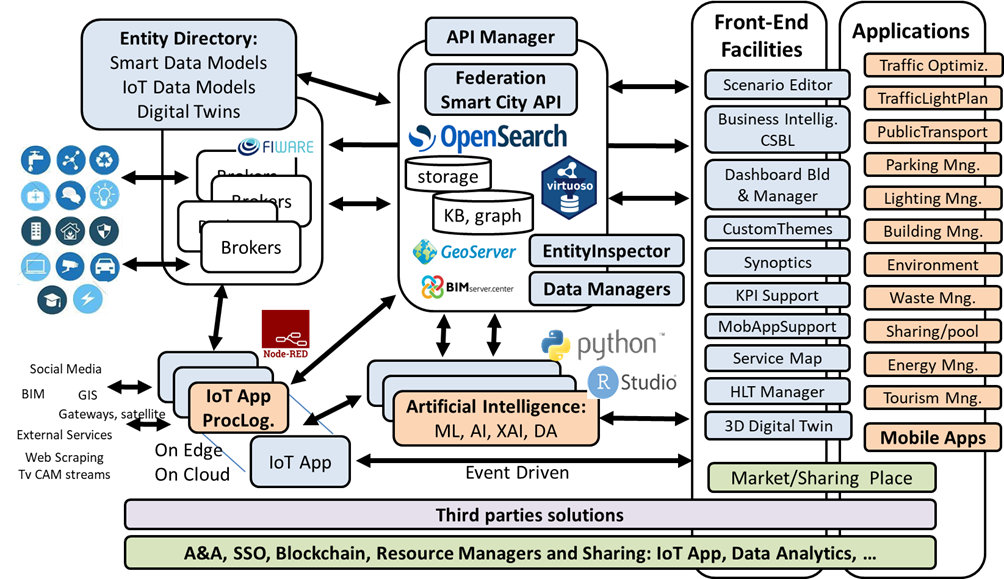
Figure: Architectural Overview of Snap4City framework
In particular, for the SMart Applications’ DEvelopment Life Cycle, SMADELC, presented in this document we refer to the previous Figure from the left side:
- data ingestion/transformation and interoperability. Data may enter/exit in push via brokers of different kinds, and/or via dedicated processes in pull/push (enabling the data/event driven approaches). Data/Entities may be listed in some Entity Directory (IoT Models, Entity Model, Entity Instances, Smart Data Model of FIWARE, data spaces).
- Data/Entity may enter/exit from in push via Brokers of different kinds. All the brokers are managed by the Entity Directory / IoT Directory which registers them and registers any kind of Data/Entity Model including the Smart Data Model of FIWARE. The brokers can be internally managed (internal Brokers) or external which are managed by third parties. The integration of external brokers with their data/entity model and devices is automated, fast and easy. Please remind that brokers can be also used to act on entities/devices on the field.
- Data arriving in the platform are stored automatically on the Storage (Open Search) and / or can be sent directly to the user interface or to data analytics for stream processing. The same flow works as data driven from entering data/entities to dashboards and from dashboards to data streams for acting and sending commands, alarms, etc. Data collected and stored can be browsed by using the Entity Inspector / Data Inspector and Data Managers (HLT) for all the High-Level Types managed in the platform. From Entities, IoT, POI, maps, heatmaps, traffic flow, etc.
- Processing Logics could be in some ETL/ELT script. In Snap4City, Processing Logic / IoT App are Node-RED plus Snap4City microservices or Python processes (to push data in NiFi which is the gate to the storage, OpenSearch). Visual programming languages such as Node-RED, NiFi are typically preferred for rapid prototyping. These processes can be also allocated on cloud, fog, edge and on premise/field.
- Data/Entities may enter/exit in push or pull via processing Logic / IoT App as described above to manage data flow from any kind of protocol and format. Please remind that brokers can be also used to act on devices.
- Data arriving in the platform are stored automatically on the Storage (Open Search) and / or can be sent directly to the user interface or to data analytics for stream processing. The same flow works as data driven from entering data/entities to dashboards and from dashboards to data streams for acting and sending commands, alarms, etc. Data collected and stored can be browsed by using the Entity Inspector / Data Inspector and Data Managers (HLT) for all the High-Level Types managed in the platform. From Entities, IoT, POI, maps, heatmaps, traffic flow, etc.
- storage and semantic models and reasoners. In Snap4City, the arrival of a new entity/data model does not imply for the developer to adequate the storage structure, but to model it on the Entity/IoT Directory once. Once a new Entity Model is registered, any instance can be directly deployed, and specific data loaded. Entities/Data entering in the platform can be automatically (i) stored (in the previous Figure: Open Search), (ii) semantically indexed, (iii) directly sent to the user interface, or to data analytics for stream processing. The same data flows work as data driven coming from dashboards to data streams for acting and sending commands, alarms, etc., in the platform and/or to external devices via brokers or processes. Data stored (in some cases, the storage is called data shadow) can be browsed by using the Entity Inspector/Manager, for all the entity/data types managed in the platform. From simple data entities to IoT devices, maps, heatmaps, flow, matrices, 3D interactive representations, scenarios, etc., as needed by the DT.
- Data Analytics can be developed in Python, RStudio, MapReduce (only in the presence of Hadoop based platforms), etc., and can be activated from: (i) Processing Logic / IoT App (Node-RED), (ii) scheduled processes, (iii) data driven events; (directly on cloud or on developers’ computers). Data Analytics may exploit stored data via some API to access at the data in the storage and may implement any kind of solution based on machine learning, AI, XAI models, tool, library or dedicated hardware you need, as NVIDIA, etc.
- data representation front-end generation with server-side and client-side business logics. User interface of smart applications can be easily developed by creating HTML generation tools, such as Dashboard Builder [Dashboards2019], which allows to select the graphics views and connect them to data/entities on storage and to data streams and brokers. Graphic widgets can be configured and scripted to create business intelligence tools by using JavaScript on client- and/or on server-sides. In the latter case, the business logic can be implemented via Processing Logic as Visual programming Node-RED. A number of tools are available for the customization of the user interface: dashboard builder editing and composition, wizards, synoptics development tools and templates, templates for the user interface themes, micro applications, etc.
- Smart Applications can be easily developed by creating the user interface with the Dashboard Builder, which allows to select the graphics views and connect them to the data of the storage and to the data streams. It is possible to glue the graphic widgets with JavaScript on client side or demanding the implementation of the business logic on server side or a mix. Server-Side Business Logic is implemented by using Processing Logic / IoT App via visual programming. A number of tools are available for the customization of the user interface: dashboard builder editing and composition, wizards, synoptics development tool and templated, templates for the user interface, ready to user micro applications, etc.
- All the data streams (internal and external) are protected, authenticated, and authorized according to [Security2020], Pen Test passed, GDPR compliant, etc.
A Conceptual version of Snap4City architecture is reported in the next figure, the main elements of which are reported and described below.
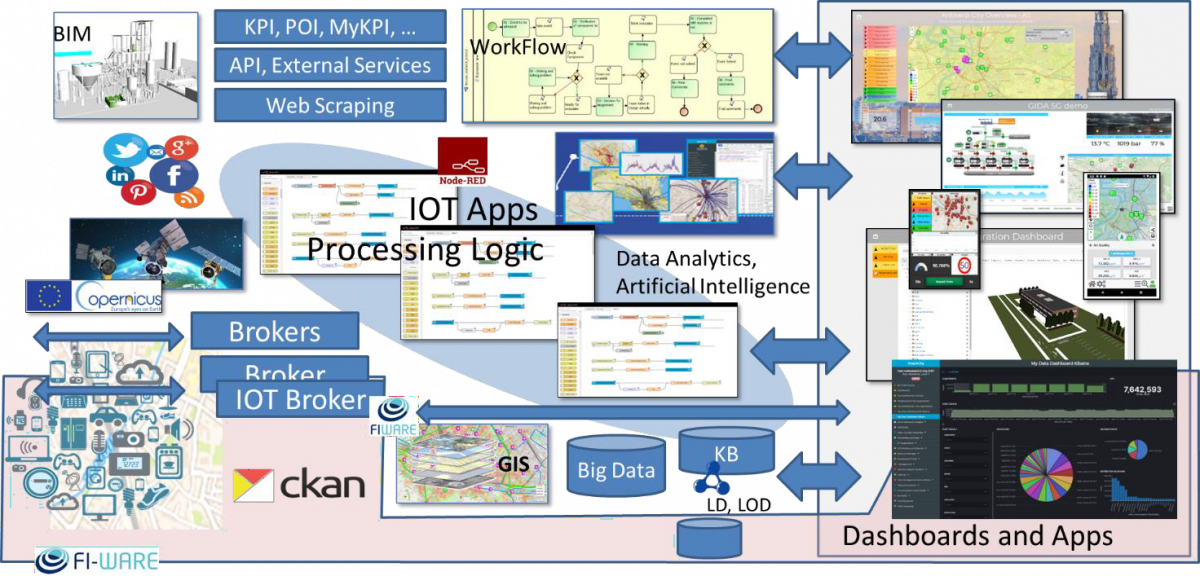
Figure: General Concept from https://www.snap4city.org/download/video/course/gen/
Conceptually, from left to right of the above figure:
Data Ingestion, transformation, aggregation and unification, as well as Data Publication are performed in push/pull by using: https://www.snap4city.org/download/video/course/iot/
- Processing Logic / IoT Apps in Node-RED and Snap4City Libraries/palette to perform data ingestion, data transformation, integration, data storage, business logic, and implementing ETL and ELT (extract transform load, extract load transform), including the exploitation of a large number of protocols: WS, FTP, REST Call, etc.
- Brokers: FIWARE IoT Connectors, IoT Agents, IoT Adapters, Brokers, IoT Brokers, also integrated with Processing Logic / IoT Apps with dedicated MicroServices and the Entity Directory / IoT Directory,
- Data Table loader and POI Loder for Excel files ingestions including IoT Device Data (Entity Instances) and POI, for bulk data ingestion, also integrated/developed with Processing Logic / IoT Apps which can be customized for each organization or for multiple table/excel kinds,
- Tools developed in Python/RStudio or other languages which can exploit the Smart City API of Snap4City for data ingestion, transformation, and registering Entity Instances from Entity Models, etc. Some of these tools are accessible as open-source processes to be customized,
- Satellite data service using dedicated Python processes also integrated with Processing Logic / IoT Apps,
- data gathering tools such as DataGate/CKAN for open data (https://ckan.org ) are also integrated with IoT Apps by using dedicated MicroServices,
- GIS data ingestion/publication via WFS/WMS, also integrated with Processing Logic / IoT Apps; for example, using GeoServer, ArcGIS, etc.,
- Web Scraping via Portia, also integrated with Processing Logic / IoT Apps.
In our experience, 99% of the data ingestion/transformation processes can be easily implemented in Processing Logic / IoT App Node-RED and managed with one or more Processing Logics / IoT Apps. Processes can be internally scheduled, and automated backup of node-red flows and versioning can be performed using Node-RED features. Only high throughput processes should be activated by using Python that can be controlled by Processing Logic / IoT App and deployed in Container, also managed by Snap4City infrastructure, or can be actually put in execution in other manners. The Python processes proposed by Snap4City can expose REST API. A template for developing Custom Tools in Python is also provided by Snap4City. For Performance analysis please see the installation page: https://www.snap4city.org/738.
In the context of big data architectures, the storage is a facility which does not need to be internally designed in terms of tables and relationships among tables (as in the old-style software engineering approach). All the data entities are modelled in terms of: Smart Data Models, Entity Models, IoT Device Models, etc. Therefore, in Snap4City, all the data models are Entity Models / IoT Device Models, also the FIWARE Smart Data Models are present into Snap4City as Entity Models / IoT Device Modes which is a higher level of model abstraction and brings automatically the relationships into a knowledge base which is a semantic graph database (an evolution of reticular databases). So that any data record in the big data platform has a definition in terms of Entity Models / IoT Device Model, which is a Data Model. Therefore, in the context of IoT, IoE and WoT Snap4City manages different entities such as: FIWARE Smart Data Models, Snap4City Entity Models / IoT Device Models, Entity Instances / IoT Devices, custom devices, and IoT Brokers/Brokers, that are registered via Entity Directory / IoT Directory, a multiprotocol multi-broker tool for IoT Network management. Among the brokers, a major role is played by Orion Broker of FIWARE by which the platform support NGSI V1, V2, and LD with Services/Tenant and Service Paths. The Entity Directory / IoT Directory is capable of automatically deploying Orion Brokers on demand. You can connect/register any Broker to Snap4City Entity Directory / IoT Directory. In this case the broker is regarded as an External Broker, not controlled by the Snap4City platform. External Orion Brokers can be harvested for registering their data on the platform in a fast manner, thus reducing connection times to existing infrastructures. A detailed description of data capabilities and networks is provided in: https://www.snap4city.org/download/video/course/iot/.
The Snap4City platform supports a very large number of protocols push/pull, sync/async. Among them are MQTT, NGSI, COAP, OneM2M, ModBus, OPC, WMS, WFS, and AMQP. To get a larger list of supported protocols see Https://www.snap4city.org/65.
For Data Formats, the Snap4City supports a large range of High-Level Types, HLT: Entity Instances, IoT Devices, FIWARE Smart Data Models, Entity Models, Sensors/Actuators, POI, Trajectories, Origin Destination Matrices, Flows, Traffic Flow, People Flows, Heatmaps, Satellite data, 3D BIM building, 3D shapes of city, social media, routing, public transport offers, geographical shapes and grids, KPI, TV Camera streams, predictions, animations, synoptics, city scenarios, events of several kinds, user profiles, custom formats, etc. A Digital Twin is an HLT instance and may present several connections to other data kinds, which in turn are instances of other HLTs. Each Digital Twin can be accessed via the so-called Data Inspector.
To remark, the Entity Models (IoT Device Models) can be used as template to create Entity Instances (IoT Devices). The Entity Instances (IoT Devices) are those that can receive messages to update their data over time, and thus to create time series. The Entity Instances and thus most of the instances of the High-Level Types need to be referred from other entities or to see them on Dashboards, etc.
References to Entity Instances are established via the so-called ServiceURI in the Knowledge Base, Service Map (also called Device URI in Entity Directory / IoT Directory). We can define the ServiceURI as a URI identifier of an Entity in the solution and it is defined according to the international standard definition of an URI: https://en.wikipedia.org/wiki/Uniform_Resource_Identifier In Snap4City, ServiceURI, also called SURI, for example as: http://www.disit.org/km4city/resource/iot/orionUNIFI/DISIT/METRO759 if you put the SURI on a browser and the SURI refers to a public entity, its definition appears since it is compliant with the Linked Data standard.
A large number of details regarding data ingestion are reported in https://www.snap4city.org/download/video/course/di/ while details regarding data formats are reported in https://www.snap4city.org/download/video/course/das/ which provides evidence that for each data formats several graphical widgets can be used for its visualization together with other kinds of data.
The Big Data Storage is managed by multiple solutions:
- Time series from Entity Instances / IoT Devices and MyKPI are automatically feed into the storage Open Search cluster (which is the new name of Open Distro for Elastic Search of AWS) for storing and indexing data.
- The Entity Instances / IoT Devices need to be registered into Entity Directory / IoT Directory, which in turn automatically registers them on Knowledge Base for reasoning.
- The MyKPI can be also stored into some SQL database.
- Knowledge Base, KB, (based on Km4City ontology) implemented as an RDF store (Virtuoso) which is an index for geospatial, relational, and temporal aspects. The KB can be federated, for example for federating different KB or different organizations. Whenever a new data model (Entity Instance or Model) is registered in the system, the registration is performed into the KB. Different instances of the KB can be federated via Smart City API by creating a mutual connection among cities/areas of the network, if the single installation wants to share, and deciding what to share.
- Heatmaps, Orthomaps, Traffic Flows Maps, and Maps are managed by the Heatmap Server which is a GIS (for example GeoServer or ArcGIS if you have one installed with WMS facilities) and can distribute the maps according to WMS/WFS protocols towards Web and Mobiles App and Dashboards. They can be loaded from Processing Logic / IoT App using specific API.
- Origin Destination Matrices are managed by the OD/ODM Manager and represented into the Multi Data Map widget in dashboards. They can be loaded from Processing Logic / IoT App using specific API.
- Internal Buildings 3D Shapes, and Floors are managed and distributed by BIM Server. Standard BIM tools are used for editing and interchange in IFC formats with standard tools such as AutoDesk Revit, etc. Buildings and Floors are shown in dashboards for their integration with maps and time trends of IoT devices. The BIM are managed on Snap4City by the BIM Manager and can be loaded from the user interface using IFC format.
- 3D City Representation can be loaded according to different components from which they are composed such as: image patterns, building shapes, 3D shapes, LIDAR data, traffic flows, POI, IoT Devices, etc. [DigitalTwin1], [DigitalTwin2], [GeneratingDigitalTwin]. They need to be loaded in agreement with the snap4city platform manager into the Dashboard area.
- Etc.
Processing Logic / IoT Apps can be used for a range of activities in data ingestion, storage, interoperability, transformation, data driven, etc. The activities of Processing Logic are better and widely described in other sections. They are also used for implementing user interface Server-Side Business Logic behind Dashboards to implement smart applications, business intelligence, including interactive Widgets, Custom Widgets and Synoptics, which can be very useful in Smart City Control Rooms. Therefore, with the Processing Logic / IoT App it is possible to create end-to-end applications which can get event driven data from the field and rendering data on a dashboard, as well as receive some command from the user to act on Processing Logic / IoT App processes and maybe act as actuator. These aspects will be recalled later on this document in the context of Dashboards. https://www.snap4city.org/download/video/course/das/.
Data Analytics are processes written in RStudio or Python that can: (i) perform data access (data taken from outside or from the Storage/KB of Snap4City Platform), (ii) apply statistics, operating research, Machine Learning, Artificial Intelligence, Explainable AI, deep learning tools, reinforced learning, algorithms also exploiting Tensor Flow, CUDA, Keras, Pandas, etc., (ii) produce results as predictions, early warning, hints, new data, heatmaps, anomaly detection, etc. Snap4City Data Analytics in RStudio, Python and IoT App can be developed by using offline and/or online development environments which also allows putting in execution of the processes in Containers which expose their API/MicroService for Processing Logic / IoT Apps and other tools in the platform. Off-line development environments are viable as well as, if preferred. The API could be made accessible from external applications if mapped on Firewall. With Data Analytics processes you can produce/compute: predictions, early warning, traffic flow reconstruction, classifications, clustering, trajectories, anomaly detection, KPIs and indicators, Typical Time Trends, typical trajectories, routing and paths, multimodal routing, travel plans, query results, simulations, analysis, calibrated heatmaps, smart parking suggestions, car sharing analysis, what-if analysis, automated ingestion of satellite data, social media processing and sentiment analysis, etc. A large number of success stories are provided in: https://www.snap4city.org/download/video/course/da/.
Smart City APIs (SCAPI) are the main entry point for accessing data from Big Data Storage (KB and Open Search). They include a large collection of services to: exploit queries and reasoning on the storage and Knowledge Base, access/control IoT Network, exploit Data Analytic results, etc. All the data and services are accessible via the Smart City APIs which are used by front-end tools such as Dashboards, Web and Mobile Apps, and MicroApplications. Details regarding Smart City APIs are reported in: https://www.snap4city.org/download/video/course/app/ . Smart City APIs provide a large set of facilities to get data filtering them by: area, path, GPS locations, distance; date and time interval; value of the variable of the models; Service URI of the entities, etc. They API are authenticated and provide data according to the authorization accesses of the user as described in the following. So that, they are very useful for implementing services from Mobile App, etc. The Snap4City platforms can be federated each other via Smart City APIs. The Smart City API can be also exposed via some API manager. For the purpose, Snap4City suggests APIMan open-source tool.
Advanced Smart City APIs, (ASCAPI) may include Smart City APIs and all other APIs for: Entity Directory / IoT Directory management, Orion Brokers direct access (if needed to get the last data and perform subscription on the eventual NGSI events), heatmap management, flow management, dashboard management, user management, process management, etc. Advanced Smart City APIs are used to federate Snap4City platforms, are documented with Swagger, and can be controlled for accounting data access and billing according to different business models. The Advanced Smart City API can be also exposed via some API manager. For the purpose, Snap4City suggests APIMan open-source tool.
Dashboards can be created by using the Dashboard Builder and/or Open Search Dashboard (former Kibana, sister of Grafana) for different kinds of users such as: decision makers, city operators, ICT operators, private users, etc., suitable for Smart City Control Rooms with video wall, for city Operators on Desktop of multiple monitors, mobile operators, and Situation Rooms with touch panels. Dashboards can exploit all kinds of data, HLT, and Data Analytics, legacy services, and special tools such as traffic flow reconstruction, decision support systems, what-if analysis, scenarios definition, etc. Dashboards are created by using a large range of ready to use Widgets (for rendering data time series, data on a map, interacting with data and tools, providing visual analytics), and also Custom Widgets creating Synoptics as SVG elements and animations, or exploiting other graphic libraries, such as D3.js, Highcharts JavaScript, etc. https://www.snap4city.org/download/video/course/das/.
Error: __clone method called on non-object in og_user_access_entity() (line 2249 of /var/www/html/drupal/sites/default/modules/og/og.module).