- TECHNICAL OVERVIEW: https://www.snap4city.org/download/video/Snap4City-PlatformOverview.pdf
- Development Life Cycle: https://www.snap4city.org/download/video/Snap4Tech-Development-Life-Cycle.pdf
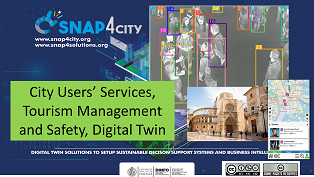
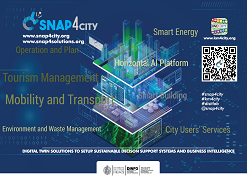
- Client-Side Business Logic Widget Manual: https://www.snap4city.org/download/video/ClientSideBusinessLogic-WidgetManual.pdf
- Booklet Data Analytics, Snap4Solutions: https://www.snap4city.org/download/video/DPL_SNAP4SOLU.pdf
Please start a fully guided training cases:
- HOW TO: create a Dashboard in Snap4City
- HOW TO: add a device to the Snap4City Platform
- HOW TO: add data sources to the Snap4City Platform
- HOW TO: define privacy rules for personal data, produced by the end-users own device
- HOW TO: Develop Smart Applications, Snap4City development Life Cycle
- HOW TO: HLT vs Ingestion, and HLT vs Widgets
- HOW TO: Develop an IOT Application for Data Ingestion
- HOW TO: Upload data into Knowledge Base, ServiceMap (triple upload)
- HOW TO: Create as set of Devices with BulkProcessing
- HOW TO: Create an IOT Device Model
- HOW TO: Create an IOT Device Instance from IOT Directory tool
Snap4City puts in the hands of City Users a flexible environment to quickly create a large range of smart city applications/views exploiting heterogeneous data and services of stakeholders by IOT/IOE and big data technologies. For Snap4City, City Users can be citizens, students, operators, researchers, decision makers, developers, etc. see Users' Roles on Snap4City. They can be registered in the Role of Managers or AreaManagers (developers, hackathon participants), depeding on the organization and related agreements. Please note that a:
All users are assessed on the basis of their activities to provide them personalized suggestions on how to pass at the next Level. All the users start at Level 0 and may increase Level up to 5, fully mastering the platform as users and contributors as described in the following. Levels 6 and 7 are reserved for administrators. |
|
Suggested Activities to be performed to learn HOW to use Snap4City:
This page would guide you along few steps to see how the Snap4City is helping you to incrementally pass from Level 0 to 5, from a Manager to an AreaManager:
- Level 0 user: access at data/services views of the city by using public Dashboards; (Public User)
(overview on dashboards)
- Level 1 user: create personal/professional views/dashboards on data; (Manager)
(see what a Manager can do),
( see how Dashboards can be created)
- Level 2 user: exploit connected IOT/IOE devices: sensors and actuators, on Dashboards or creating an IOT App as anticipating some of the test cases of Level 4; (Manager)
- Level 3 user: connect your IOT Device (sensor, actuators) or creating an IOT App as anticipating some of the test cases of Level 4, and use/control on Dashboards; (Manager)
- Level 4 user: create personal IOT/IOE Applications defining the control logic/rule behind your Dashboard; (role: Manager)
(dashboard vs IOT Devices vs IOT applications)
- Level 5 user: develop complex applications and services for the city; (Role: Area Manager)
(see what an Area Manager can do)
- Level 6 users and above
The users typically are registered as Manager/Level 0. They can pass at the next Levels only by conquering them by demonstrating to be capable to create Dashboards, IOT Applications, etc. The first Levels are still for Managers. The progresses for the Levels are described in this page. Level 5 can be reached only becoming an AreaManager.
The AreaManagers are the developers and/or contributors of the platform, and may have several benefits, including more power, data access, etc. etc.
The attribution of the AreaManager role is provided on the basis of the activitiy performed as in the passing from Level 0 to Level 4. Once arrived at Level 4 please performs your submission by using the contact form accessible on https://www.snap4city.org/drupal/contact FORM.
The Organizations (cities, regions, univeristy, research centers, etc.) can directly subscribe for their personnel a number of users with the role of AreaManager or higher.
Please note that, all the users, may collaborate in the city Living Lab by sharing solution and experiences via the Snap4City Portal; access to documentation; help desk; FAQ; personal user profile and data management according to GDPR. The Snap4City solution also provides two more levels for ToolAdmin e RootAdmin. They are covered by few experts to manage the solution and provide your services according to roles described in Users' Roles on Snap4City. You can contact them on https://www.snap4city.org/drupal/contact
If you are interested in getting an overview you should read:
- TC1.1. The main entry of the Snap4City service: www.snap4city.org
- TC1.2. Different Tools and Functionalities Accessible for user category
Please provide a Feedback
Level 0 User: Access at data/services views of the city by using public Dashboards; (Public User)
The simplest usage of Snap4City solution is as observer as called Public User (Level 0 User). The public users do not need to be registered. They can access to https://www.snap4city.org and see the public information and Dashboards. Public Dashboards are tools for rendering status and trends of data and services, providing making decision support, real time values and historical values, maps and histograms, etc.
A list of public dashboards can be accessed via: https://www.snap4city.org/dashboardSmartCity/management/dashboards.php
Dashboards can be viewed on PC, mobile devices and large monitors, and are composed of graphic Widgets which can include several kinds of High Level Types (see Snap4City terminology Snap4City Terminology ), such as:
- Knowledge and Maps via: Google map, Open Street Map, ServiceMap & ServiceMap 3D https://servicemap.snap4city.org to see POI, Point of Interest; sensor; etc.
- External Services: maps, traffic flows, people flow heatmap, Wi-Fi map, etc.
- MicroApplications: micro scenarious as applications, also using Knowledge Base
- Complex Event and selectors to show element on maps: traffic event, entertainment, etc.
- Values and trends on graphics, tables, charts, coming from: KPI, Key Performance Indicators about specific services; and real time data from sensor, actuators, etc.
- Special Widgets: weather forecast, civil protection, semaphore, speed limit, etc.
We suggest to follow these examples and readings in the order, they are for Mobility and transport, energy, health, etc.:
- TC1.3. Accessing and using Dashboards with any device
- TC1.4. Dashboards Showing Data Real Time and Historical/trends, comparison
- TC1.5. Dashboards showing a range of different High Level Types: KPI, POI, IOT dev, MicroApp, Maps using different kind of Graphics Widget. Monitor city status with Dashboards
- TC1.6. Dashboards using different kind of graphics Widgets matching with High Level Types, Monitor city status with Dashboards
- TC1.12. Dashboard with MicroApplications
- TC4.1. Dashboard and Notificator
- TC4.6. Dashboard with city events, ESB, police, traffic, etc
Please provide a Feedback
Level 1 User to create personal/professional views/dashboards on data; (Manager), a video on how to create Dashboards
,
To perform activities at this level and thus to create your Dashboard you need to be registered.
To register, click on https://www.snap4city.org/drupal/user/register
Once registered you are the Manager of your data, and you can create your applications, dashboards, attach/register your IOT devices, create IOT applications, etc.
At this Level 1, we suggest to learn how to create your dashboard by exploiting the data that the Snap4City solution on the city is providing to you. To this end, you do not need to have yregistered our sensors, and neither to be capable of programming. You just need to follow the instructions of the Dashboard Wizard to produce your Dashboard and/or to add other Widgets to an already available Dashboard.
To create a new dashboard, clickon the main menu on left à Dashboard , and from the list of them click to “New Dashboard”, and thus you enter in the wizard in which you can decide to start by using some models that may simplify you dashboard creation. They are ordered according to their complexity. We suggest you to start from the simplest as reported in the following examples.
To add Widgets to a Dashboard by using the Wizard, please open in Edit your dashboard and select the Wizard fro mthe top menu.