This document describes the recommended practices and tools for building fully customizable interactive and real-time animated SVG synoptics/Widgets. (sinottico in italiano)
A synoptic (sinottico in italiano) is an interactive view which may include:
- Graphic elements describing the scene
- Graphic elements changing on the basis of data values
- Graphic elements that can be interactive to send data into the platform
- Graphic elements with animations, etc.
In Snap4City, the technology for creating synoptic panel (as custom dashboards) can be also used for creating custom graphic widgets. Examples are reported in the following. If you do not see them in the figure (that is, when at the place of the number a # is shown), means that you are not authorized to access at those data, or that connection or authentication problems are experienced.
They are accessible from a Dashboard: https://www.snap4city.org/dashboardSmartCity/view/index.php?iddasboard=MjE4Mg==
See for a list of Custom Widgets: Table explaination, as SVG with their usag and variables
Click here to see the list of the Public templates of complete widget synoptics that can be instantiated into dashboards: https://www.snap4city.org/dashboardSmartCity/management/synopticTemplates.php
Tiny elements of the synoptics are composed to create any kind of complex synoptic with real time data rendering via the SVG editor. See tutorial: https://www.snap4city.org/drupal/node/595
if You are interested to creating a custom synoptic but you do not have the time and skill, you can ask us to design/realize for you the custom element, that could remain private for you only.
please note that Custom Widgets can be directly controlled from IOT Applications to create event driven solutions: TC9.19: Custom Widgets / Synoptics controlled by IOT Applications
|
|
In this first example, a graphic layout is representing an industrial plant. A number of variables are reporting variable values coming from sensors, which are updated in real time. These are solutions Industry 4.0, Snap4Industry.
|
|
|
In this case, a graphic layout is representing an industrial plant. A number of variables are reporting variable values coming from sensors, which are updated in real time. These are solutions Industry 4.0, Snap4Industry. In this case, the panel presents: (i) some buttons on which the user can interact to change their on/off, (ii) variables reporting numbers, (iii) text box for inserting data, (iv) graphic element with changing status (motors, buttons, etc.) according to the value of some variable value, (v) a thank with graphic representation of the liquid level, (vi) etc.
|
|
|
In this case, we can call it more a Custom Widget rather than a synoptic panel. This Custom Widget represent graphically the major tramlines in Florence, actual and planned, and the Red Star the real time position of the Tramway. The Star can move according to a set of predefined positions. These are solutions Snap4City |
 |
This Dashboard includes a Custom Widget realized in SVG for setting the Begin and the End of a time window. The user can change the time set by using plus and minu 30 minutes at the actual value on the server. Once set the times the data are used for programming a PAX Counter devices by pressing Activate. The data are processed into an IOT Application to program a PAX Counter. See details on TC9.15: PAXCounters of different kinds: Counting the number of people |
 |
The dashbord include a water depuration plat interbgrated with Smart City asepcts of the area. A number of variables are reporting variable values coming from sensors, which are updated in real time. These are solutions Industry 4.0, Snap4Industry vs Snap4City solution. In this case, the panel presents: (i) some buttons on which the user can interact to change their on/off, (ii) variables reporting numbers, (iii) text box for inserting data, (iv) graphic element with changing status (motors, buttons, etc.) according to the value of some variable value, (v) a thank with graphic representation of the liquid level, (vi) etc. The elements on the plat are interactive, and allow drill down on plant data, as well as those in the city. Data Analytics is done for better control, prediction, anomaly detections. |
 |
A solution for collecting feedbacks. The esample reports two series of faces. Above one is just for demonstrating the couting, the number of clicks perfomred and the mean rate. It is also possible to have the trend of the votes for each kind of scores, for the number of click per day, for the mean value in the last day, week, month, etc. |
 |
a solution for monitoring parking status. The color of the cars drawn represent a code. For example, balck when it is a regular parking, red if the parking is longer than consented in agreement to the paiment performed, green if the vechicles are car sharing available to be taken. |
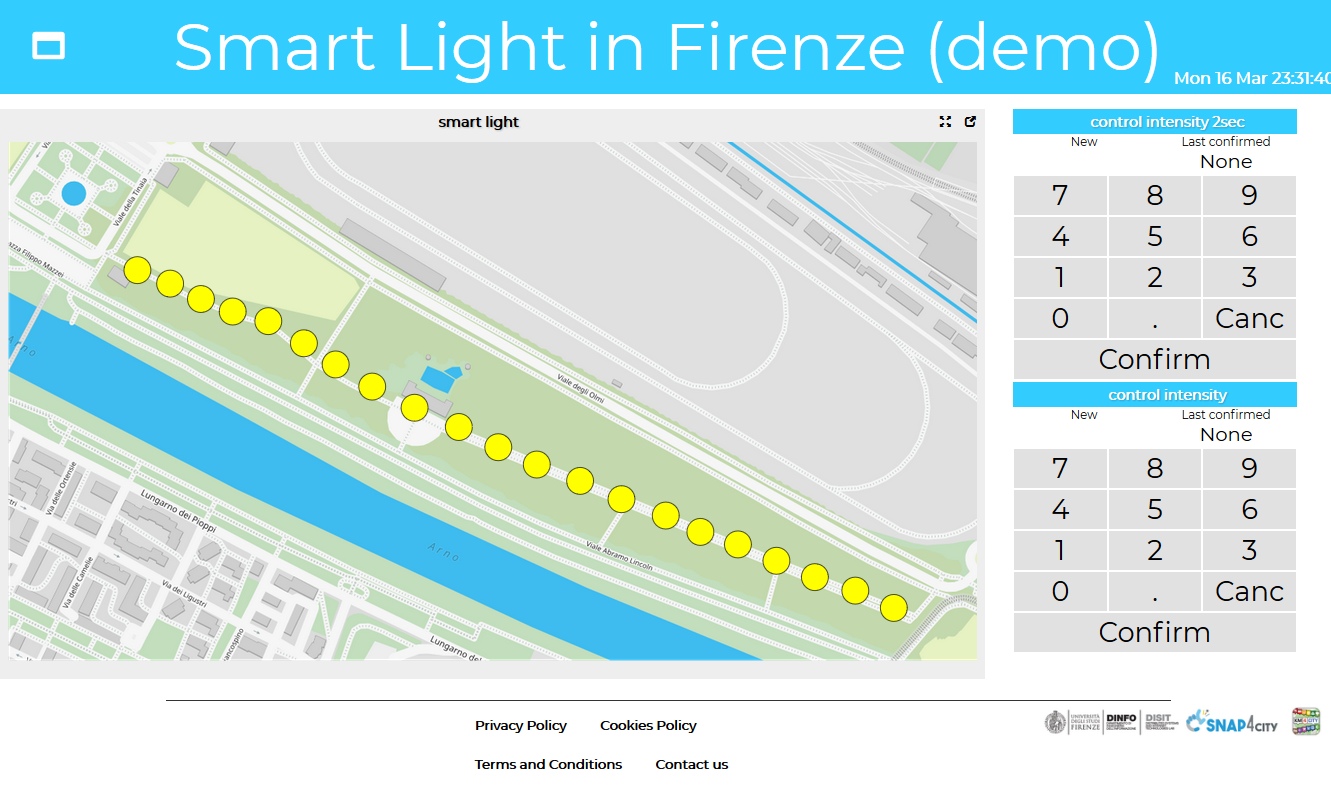 |
This dashboard includes a cusotm widget for managing a smart light. A sequence of led lamps that can be controlled by some logic. the example shows controls for intensity at segments, and fine interface. You can set the light intensity with kay pad from (1 to 10) and dimmer, or set preparedsetting, as well to turn off the whole set. |
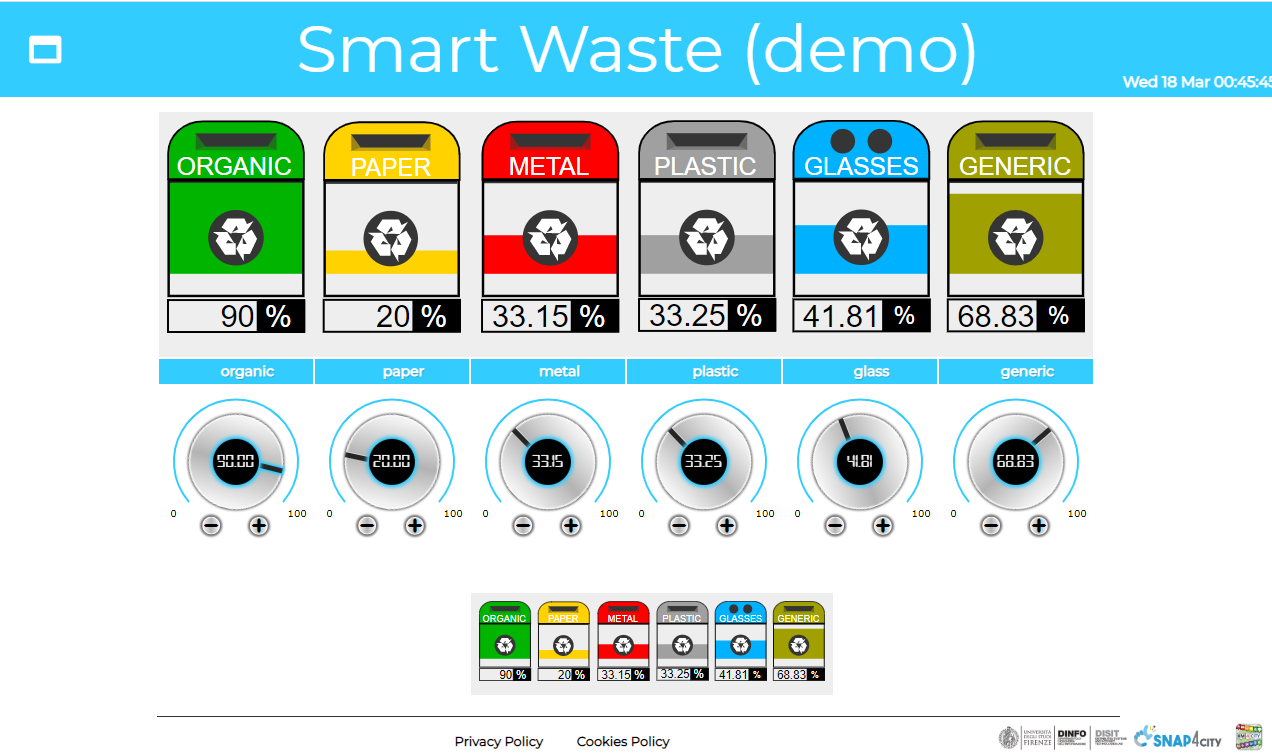 |
this dashboard included a custom widget in two instances for reporting and controlling the waste storage. you can play with dimmers to change the animation. |


In Snap4City, the values presented in Custom Synoptics/Widgets can be connected to MyKPI. In order to develop these Custom Synoptics/Widgets a number of steps are needed as described in the following.
The first step is the construction of the graphic element in SVG.
please read https://www.snap4city.org/drupal/node/595 to understand how to create an SVG based widget custom.
please note that Custom Widgets can be directly controlled from IOT Applications to create event driven solutions: TC9.19: Custom Widgets / Synoptics controlled by IOT Applications