Snap4City Smart City Digital Twin, 2026 version
Below is a consolidated list of functionalities for the Snap4City 3D Digital Twin / Widget3DMap, taking into account the Digital Twin page and the attached Widget3DMap with 3D Building Editor Documentation. The Snap4City 3D Digital Twin already supports 3D city visualization, runtime layers, IoT/service pins, traffic and environmental data, predictions, routing, OD matrices, what-if analysis, dashboards, and maintenance/event-management features. (digitaltwin.snap4city.org) The attached document extends this with a 3D building editor for uploading, positioning, storing, and reusing custom GLB models.
1. 3D city digital twin visualization
-
3D terrain visualization with orthomaps and heatmaps.
-
3D buildings, urban elements, roads, decorations, trees, and additional 3D entities.
-
Multiple map layers with configurable opacity.
-
Support for different 3D building representations, including extruded buildings, high-value meshes, roof reproduction from LiDAR, and textured models.
-
Support for Google 3D Tiles as an alternative representation layer, while keeping other Snap4City entities overlaid on top. (digitaltwin.snap4city.org)
2. Interactive map and entity exploration
-
Building picking / selection from the 3D map.
-
Side panel showing building metadata after selection.
-
Access to real-time IoT data associated with selected buildings.
-
Selection of services and IoT entities represented as clickable PINs.
-
Visualization of POIs, bus stops, parking, traffic, environmental data, public transport, smart lights, control assets, and other city services. (digitaltwin.snap4city.org)
3. 3D building model catalogue
-
Display the list of available 3D models for a selected building.
-
Switch between default and alternative 3D models.
-
Associate multiple 3D models with the same building through
3DModelList. -
Store the first model as the default local path and additional models as SURI links to
3DModelBuildingentities. -
Keep backward compatibility with legacy
buildingModelentities; ifbuildingModel_v2is not available, the system shows legacy building information and disables the 3D editor.
4. 3D building editor
-
HOW TO edit: Digital Twin: Snap4City 3D Building Editor Documentation
-
Activate the editor from the Building New Tiled option.
-
Select an existing building from the 3D map.
-
Open the 3D editor for buildings where the user has ownership or write delegation.
-
Load a new
.glbmodel from the user’s computer. -
Place the uploaded model directly inside the 3D digital twin.
-
Interactively edit the model with a gizmo:
-
Position with keyboard key
1. -
Rotation with keyboard key
2. -
Scale with keyboard key
3.
-
-
Use
CTRLto interact with the transform gizmo. -
Use orthographic/top-down view for more precise positioning.
-
Keep the custom model aligned with the map projection and depth buffer so it is correctly positioned, occluded, and moved with the rest of the 3D city scene.
5. Upload, storage, and persistence
-
Upload new 3D models into the Snap4City knowledge base.
-
Bake the user’s edits into the 3D model geometry.
-
Save the transformed model as a new file entity.
-
Create a
fileModelentity to store the reference to the actual binary GLB file. -
Create a
3DModelBuildingentity to store model metadata. -
Associate the new
3DModelBuildingentity with the correspondingbuildingModel_v2. -
Make the new model immediately available in the building’s model catalogue after saving.
6. 3D model metadata management
-
Store model description.
-
Store model kind / level of detail, for example LOD1, LOD3, BIM, or similar.
-
Store
dateObserved. -
Store
dateTime, useful for what-if and scenario-based modelling. -
Store the SURI link to the file device that contains the binary model.
-
Maintain building metadata such as city, address, OSM ID, building type, number of levels, height, accessibility, website, Wikidata, Wikipedia, ground shape, and model list.
7. Access control and ownership
-
Only registered users with ownership or write delegation can add a model to a building.
-
Uploaded 3D files are created as private devices owned by the uploading user.
-
Only the owner or authorized delegated users can substitute the default building model with uploaded custom models.
-
Unauthorized users cannot access private 3D models without sufficient permissions.
8. Model validation and technical constraints
-
Accept 3D models in GLTF/GLB format.
-
Require the GLB file to include material information to avoid corrupted-looking vertex colors.
-
Support DRACO-compressed GLB files.
-
Enforce a maximum supported size of about 50 MB for DRACO-compressed GLB files.
-
Require the GLB file to contain one and only one mesh.
-
Provide guidance on decimation/compression: in the attached tests, models compressed below the 50 MB DRACO threshold were usable, while larger ones produced errors related to peak WASM decoder memory.
9. What-if and scenario functionalities
-
Add alternative building models to represent future, planned, temporary, or hypothetical urban configurations.
-
Swap between existing/default and user-added 3D models.
-
Use
dateTimein3DModelBuildingto reference scenarios over time. -
Support visual comparison of urban design alternatives.
-
Support decision-making, simulation, and planning use cases through Snap4City’s broader what-if analysis tools. (digitaltwin.snap4city.org)
10. Mobility, traffic, and environmental functionalities
-
Visualize traffic density with 3D animated arrows, crests, columns, pillars, or pins.
-
Show traffic sensors as 3D columns.
-
Show heatmaps and animated heatmaps for people flow, traffic flow, weather, pollutants, air quality indexes, KPIs, and related indicators.
-
Display predictions for traffic, pollutants, weather conditions, critical events, parking, people flow, and KPIs.
-
Display OD matrices and animated OD matrices.
-
Support routing, dynamic routing, constrained routing, and multimodal routing. (digitaltwin.snap4city.org)
11. Dashboard and operational functionalities
-
Integrate the 3D digital twin inside Snap4City dashboards.
-
Combine the 3D map with additional widgets.
-
Update widgets interactively using client-side business logic.
-
Support ticketing for maintenance.
-
Support event management and early warning.
-
Configure map performance settings such as maximum number of tiles, minimum 3D zoom, traffic animation, road information, decorations, and realistic decorations. (digitaltwin.snap4city.org)
12. Main limitations addressed by the new editor
The new 3D editor removes several previous limitations:
-
New models no longer need to be manually copied by a developer into the server tile directory.
-
Placement, rotation, and scale are no longer fixed by hardcoded configuration.
-
Users can upload custom GLB files themselves.
-
Users can interactively position, rotate, and scale models in the city digital twin.
-
Multiple models can be associated with the same building through a structured model catalogue instead of storing only a single model path and description directly inside the building entity.
See also WEB page for the 3D building placement and EDITOR, with details regarding the Digital Twin 3D representation and model for LIDAR data:
HOW TO edit: Digital Twin: Snap4City 3D Building Editor Documentation
The version presented at Smart City Expo World Confrence 2024 in Barcellona is not publicly accessible.
https://www.youtube.com/watch?v=vYeb485nYJ8&t=183s
You can access to the demonstrator by sending a request to snap4city@disit.org
"Smart City Digital Twin Framework for Real-Time Multi-Data Integration and Wide Public Distribution", IEEE Access, IEEE, 2024. pp: 1-27, ISSN: 2169-3536, ISSN: 2169-3536, DOI: 10.1109/ACCESS.2024.3406795 https://ieeexplore.ieee.org/document/10540577
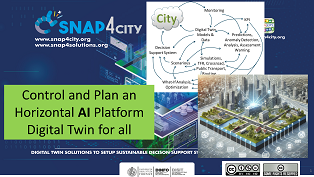
Cityverse consists of creating a digital counterpart always aligned of your building and city on which you can perform analysis, simulation, what-if analysis. This is precisely what Snap4City Digital Twin provides as ready to use tool. https://www.snap4city.org/989
Snap4City is an official certificated FIWARE platform, and is a platform of OASC, and of EOSC.
- M. Fanfani, L. A. Ipsaro Palesi, P. Nesi, "Microservices’ Libraries Enabling Server-Side Business Logic Visual Programming for Digital Twins", SoftwareX, Elsevier, 2024.
"Microservices’ Libraries Enabling Server-Side Business Logic Visual Programming for Digital Twins", SoftwareX, Elsevier, 2024.
Digital Twins of Smart Cities are fundamental tools for decision makers since they can provide interactive 3D visualizations of the city enriched with real-time information and connected to actual complete digital model of the entities with all their heterogeneous data/info. Such a technology can be exploited to observe the status of the city, and to perform analysis and simulations, and thus to develop strategies. Snap4City provides an open-source framework for creating enhanced Global Digital Twin intgrated with Local Digital Twins. The Snap4City Digital Twin is able to manage multiple kind of entities, from 3D representation of the urban infrastructures to information about services, traffic, air quality, parking, environmental data, IoT data, gove data, KPI, SUMI, PUMS, planning, etc., and others.
many other features. See training on Snap4City platform: https://www.snap4city.org/944
https://digitaltwin.snap4city.org
For Digital Twin / CityVerse we intend the modelling and management of physical entities with digital entities, by monitoring, simulation and control. In the context of cities and industries we can have a digital counterpart describing all aspects including data flow, time series, structural details of the design, control and functional aspects, and also 3D shapes to see them in the 3D representation in digital https://www.snap4city.org/749 . The Digital Twin local refers to local details of a building or of a single machine/area, while the Global refers to the coverage of the model among several entities. Data, and interaction can be on physical entities and provoke changes in the digital or viceversa, the two worlds should be actually twined, or merged, or better they should be the same thing, in some cases the digital model can be used to explore other cases, for example in simulation, optimisation, etc. Snap4City’s comprehensive suite of tools and technologies offers a robust foundation for creating smart city solutions that are compatible with CityVerse, adhere to MIMs Plus standards, and utilize the DS4SSCC blueprint and the LDTs Toolbox. This integration promotes the development of innovative, interoperable, and impactful smart city projects. In Snap4City, Digital Twins are integrated with IoT Device Models, maps, heatmaps, structure, functional, services, and 3D representations, etc. They can be used for making changes into the virtual world and see the action of the physical, or just to apply temporary changes to show them at the stakeholders, thus facilitating the decision-making process in close to realistic conditions.;
At level of Digital Twin local detailed aspects are modelled in digital of a physical element, for example of a chemical plant with machines, motors, silos, etc., each of them with 3D representation, detailed components, and real-time values of sensors attached which can be used to understand its behaviour in terms of real-time data and functionalities, mechanical parts to be disassembled for maintenance and inspection, etc. Several different levels of resolutions can be provided and the rendering is typically performed on 3D modelling and visualization tools such as the BIM Manager (https://www.snap4city.org/730 ). The 3D shape is obtained by starting from formats such as IFC, DXF, SVG (Scalable Vector Graphics), STEP, IGES, STL (Stereolithography), OBJ (Wavefront), DAE (Collada), SCAD (OpenSCAD), and IV (Inventor). The Local Digital Twin also may include the detailed description of floors, detailed description of data, devices, etc.
Snap4City provides support for creating Global Digital Twin of the city with integrated Local Digital Twins, it is part of the Dashboard Builder of Snap4City which is 100% open source. It is possible to pass from Digital Twin to the Local Digital Twin such as “entering in the detailed view”. The 3D representation and view of the Digital Twin in Snap4City can manage multiple layers on the map with different levels of opacity.
Snap4City 3D City Modelling Framework for Smart City Digital Twin is covering terrain elevation, roads, building planimetries, maps, orthomaps, heatmaps, buildings, high-value buildings with meshes, building extrude from their plant shape, roof reproduction from LiDAR data, pattern extraction and positioning for roofs and facades, traffic flow data, IoT Sensors/actuators, POI, traffic flows, bus routes, cycling paths, building, scenarios, optimisation, what-if analysis, etc. The LDTs Toolbox provides methodologies and tools aim at creating and managing Living Digital Twins of urban environments. Snap4City’s features, such as advanced analytics, simulation, and visualization technologies, complement the LDTs Toolbox by enabling the development of dynamic and interactive digital twins. Snap4City can simulate real-world scenarios, support decision-making processes, and facilitate urban planning and management, all while being integrated with the broader smart city ecosystem. Interoperable Data Spaces: Snap4City’s platform is built on open standards and supports the creation of interoperable data spaces for smart cities, as a secure and unified marketplace for data that promotes the development of new products and services.
Google released photorealistic 3D tiles that can be exploited to represent city buildings. In this case, the Google 3D tiles are loaded using a Tile3DLayer replacing the Terrain, the 3D Buildings, and the Additional 3D elements layers of our architecture (see Figure). All the other entities included into our SCDT can still be represented over the Google 3D tiles effortlessly, thanks both to our layered architecture design which is able to handle any different kinds of data to be displayed, and to the underlying Snap4City Knowledge Base and services that can be queried to retrieve road descriptions, position of POIs, heatmaps, and to perform What-If analysis. As an example, we have reported the usage of the Google 3D tiles into our Snap4City SCDT interface for the cities of Florence and Helsinki. In the first case – Figure 15(a)– all the elements described in the previous sections (i.e., PINs, 3D Traffic Crests, heatmaps, paths, etc.) can still be represented when using Google tiles, thus demonstrating how the proposed digital twin architecture does not depend on the used 3D building representation. Conversely, in Figure the city of Helsinki is shown in the proposed SCDT framework, together with some PINs indicating the position of POIs, demonstrating how our solution can be effectively deployed in different municipalities. It should be remarked however that the adoption of Google 3D tiles imposes some restrictions, both on usage licenses (that at the time of our writing are not yet well defined by Google) and on the interactivity, since in 3D tiles different buildings are fused in a single mesh. Indeed, in this case, building substitution is no longer possible without elaborating Google tiles to single out individual buildings (something that licenses do not permit). However, we managed to provide a building picking functionality thanks to a smart solution exploiting invisible extruded buildings used to delimit volumes of single structures.
Snap4City provides an efficient and cheap approach for (i) the production process from raw data to 3D Digital Twin elements, (ii) the integrated model for Digital Twin representation and distribution on the web, (iii) the performance in production and distribution of the resulting integrated Digital Twin model. The 3D representation is enriched with: a 3D representation of crests for traffic flows, 3D shapes, and dynamic PINs which can manifest data values for real-time IoT data representation, heatmaps, and animations, picking functionality for building and data elements, and interactivity with all the elements from dashboards.
At level of Digital Twin local detailed aspects are modelled in digital of a physical element, for example of a chemical plant with machines, motors, silos, etc., each of them with 3D representation, detailed components, and real-time values of sensors attached which can be used to understand its behaviour in terms of real-time data and functionalities, mechanical parts to be disassembled for maintenance and inspection, etc. Several different levels of resolutions can be provided and the rendering is typically performed on 3D modelling and visualization tools such as the BIM Manager (https://www.snap4city.org/730 ). The 3D shape is obtained by starting from formats such as IFC, DXF, SVG (Scalable Vector Graphics), STEP, IGES, STL (Stereolithography), OBJ (Wavefront), DAE (Collada), SCAD (OpenSCAD), and IV (Inventor). The Local Digital Twin also may include the detailed description of floors, detailed description of data, devices, etc. Snap4City provides support for creating Global Digital Twin of the city with integrated Local Digital Twins, it is part of the Dashboard Builder of Snap4City which is 100% open source. It is possible to pass from Digital Twin to the Local Digital Twin such as “entering in the detailed view”. The 3D representation and view of the Digital Twin in Snap4City can manage multiple layers on the map with different levels of opacity. Snap4City 3D City Modelling Framework for Smart City Digital Twin is covering terrain elevation, roads, building planimetries, maps, orthomaps, heatmaps, buildings, high-value buildings with meshes, building extrude from their plant shape, roof reproduction from LiDAR data, pattern extraction and positioning for roofs and facades, traffic flow data, IoT Sensors/actuators, POI, traffic flows, bus routes, cycling paths, building, scenarios, optimisation, what-if analysis, etc. The LDTs Toolbox provides methodologies and tools aim at creating and managing Living Digital Twins of urban environments. Snap4City’s features, such as advanced analytics, simulation, and visualization technologies, complement the LDTs Toolbox by enabling the development of dynamic and interactive digital twins. Snap4City can simulate real-world scenarios, support decision-making processes, and facilitate urban planning and management, all while being integrated with the broader smart city ecosystem. Interoperable Data Spaces: Snap4City’s platform is built on open standards and supports the creation of interoperable data spaces for smart cities, as a secure and unified marketplace for data that promotes the development of new products and services. Snap4City provides an efficient and cheap approach for (i) the production process from raw data to 3D Digital Twin elements, (ii) the integrated model for Digital Twin representation and distribution on the web, (iii) the performance in production and distribution of the resulting integrated Digital Twin model. The 3D representation is enriched with: a 3D representation of crests for traffic flows, 3D shapes, and dynamic PINs which can manifest data values for real-time IoT data representation, heatmaps, and animations, picking functionality for building and data elements, and interactivity with all the elements from dashboards.
At level of Digital Twin local detailed aspects are modelled in digital of a physical element, for example of a chemical plant with machines, motors, silos, etc., each of them with 3D representation, detailed components, and real-time values of sensors attached which can be used to understand its behaviour in terms of real-time data and functionalities, mechanical parts to be disassembled for maintenance and inspection, etc. Several different levels of resolutions can be provided and the rendering is typically performed on 3D modelling and visualization tools such as the BIM Manager (https://www.snap4city.org/730 ). The 3D shape is obtained by starting from formats such as IFC, DXF, SVG (Scalable Vector Graphics), STEP, IGES, STL (Stereolithography), OBJ (Wavefront), DAE (Collada), SCAD (OpenSCAD), and IV (Inventor). The Local Digital Twin also may include the detailed description of floors, detailed description of data, devices, etc.
Snap4City provides support for creating Global Digital Twin of the city with integrated Local Digital Twins, it is part of the Dashboard Builder of Snap4City which is 100% open source. It is possible to pass from Digital Twin to the Local Digital Twin such as “entering in the detailed view”. The 3D representation and view of the Digital Twin in Snap4City can manage multiple layers on the map with different levels of opacity.
Snap4City 3D City Modelling Framework for Smart City Digital Twin is covering terrain elevation, roads, building planimetries, maps, orthomaps, heatmaps, buildings, high-value buildings with meshes, building extrude from their plant shape, roof reproduction from LiDAR data, pattern extraction and positioning for roofs and facades, traffic flow data, IoT Sensors/actuators, POI, traffic flows, bus routes, cycling paths, building, scenarios, optimisation, what-if analysis, etc. The LDTs Toolbox provides methodologies and tools aim at creating and managing Living Digital Twins of urban environments. Snap4City’s features, such as advanced analytics, simulation, and visualization technologies, complement the LDTs Toolbox by enabling the development of dynamic and interactive digital twins. Snap4City can simulate real-world scenarios, support decision-making processes, and facilitate urban planning and management, all while being integrated with the broader smart city ecosystem. Interoperable Data Spaces: Snap4City’s platform is built on open standards and supports the creation of interoperable data spaces for smart cities, as a secure and unified marketplace for data that promotes the development of new products and services.
Snap4City provides an efficient and cheap approach for (i) the production process from raw data to 3D Digital Twin elements, (ii) the integrated model for Digital Twin representation and distribution on the web, (iii) the performance in production and distribution of the resulting integrated Digital Twin model. The 3D representation is enriched with: a 3D representation of crests for traffic flows, 3D shapes, and dynamic PINs which can manifest data values for real-time IoT data representation, heatmaps, and animations, picking functionality for building and data elements, and interactivity with all the elements from dashboards.
Demos
...
...
Interface
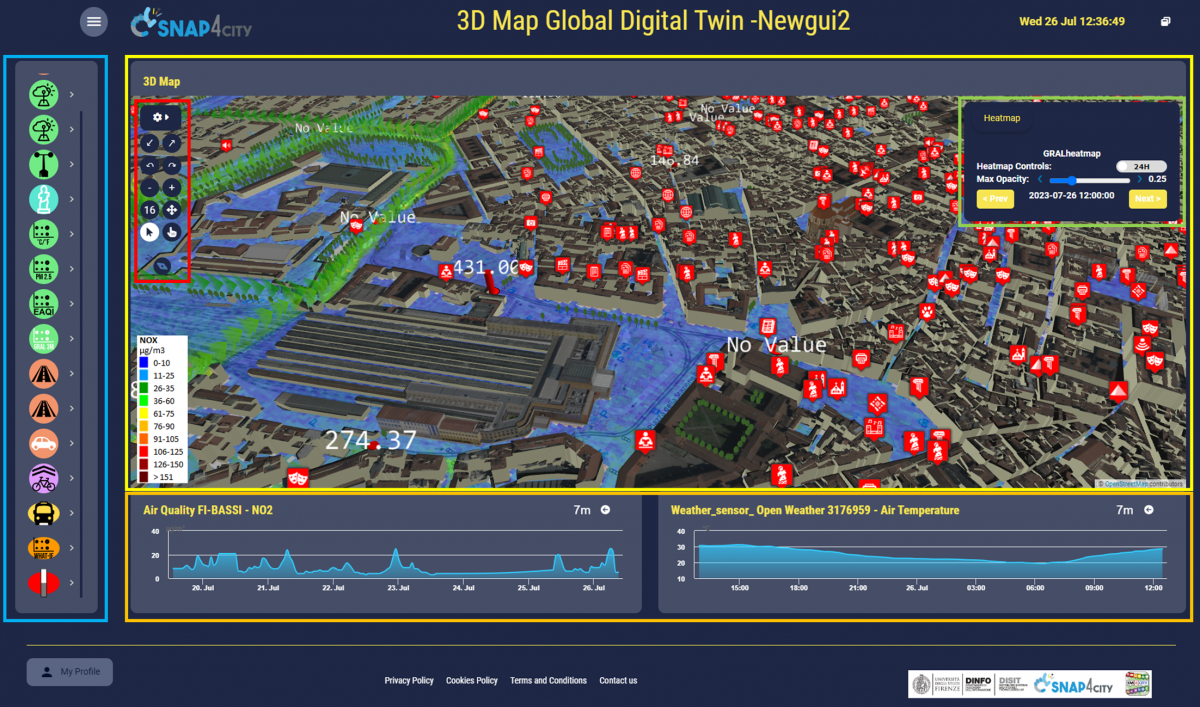
For example, a Digital Twin Dashboard is organized in three main parts, you can create your own dashboard with any theme and composed widgets as you like by using snap4city dashboard elements. In the above example, on the left, the blue rectangle highlitgh the selector menu where each button can be used to activate different information, e.g., services, heatmaps, paths, What-If analysis tool. In yellow the main 3D multi-data map, with the in-map menu (red rectangle) and the interactive pannel (green rectangle). Under the map, in the orange rectangle, addional widget can be visualized and updated interactivelly thanks to client-side business logic.
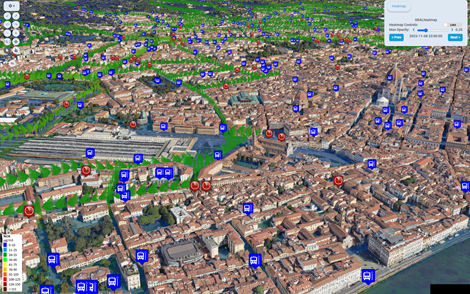
Main Functionalities on 3D example above
-
3D terrain textured with orthomaps and heatmaps selectable at run-time. Use the selector menu to activate different heatmaps. Use the in-map menu "Orthomaps" to change the ground texture.
-
3D buildings, and additional urban elements, supporting picking, interaction, substitution, and BIM integration and inspection (select from the in-map menu "Buildings -> Building New Tiled" to get the lastest functionalities)
-
Interactive road graph, with all the needed details you may need.
-
Services and IoT Data, represented as PINs, to show IoT devices, points of interest, bus stops, traffic, parking, environmenal data, public trasport, smart light, control assessts, etc. etc. Services can be activated from the selector menu. Each PIN can be clicked to access to specific information
-
Traffic density as 3D animated arrows or crests, or simple pillars/pins for the sensors
-
Traffic sensors as 3D columns
-
predictions: traffic, pollutant, weather conditions, critical events, parking, people flow, KPIs, etc.
-
heatmaps and animated heatmsps about people flow, traffic flow, weather conditions, pollutant of any kind, air quality indexes, KPI, etc.
-
OD matrices, and animated OD matrices, regarding grid, gov areas, census areas, etc.
-
What-If tool to assess impact of changes in the urban environment, for tactic and strategic analysis. Use the selector menu to activate the tool and select possible scenarios in the future of your city or in real time.
-
Routing and dynamic routing, constrained routing, multimodal routing, etc.
-
ticketing management for maintenance,
-
event management, early warning
-
many other features. See training on Snap4City platform: https://www.snap4city.org/944
Settings in this case:
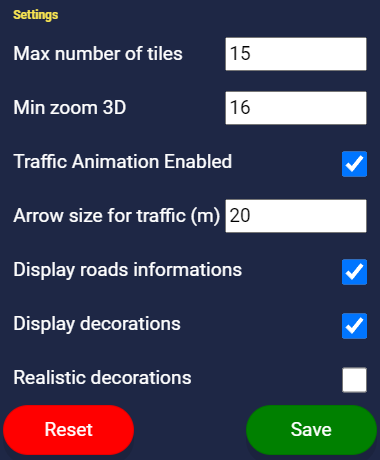
By clicking on the gear icon on the in-map menu on the top left corner of the map, you can access to the Settings panel to set the following configuration parameter:
-
Max number of tiles: define the maximum number of building tiles to be shown at the same time in the map. By increasing this value more buildings are shown in the map, augmenting client resource usage. We suggest to limit this value if you face sluggishness or excessive use of resources.
-
Min zoom 3D: indicate the minimum zoom level over which no building are shown. By decreasing this value, buildings are shown on wider zoom level augmenting the area covered and increasing the use of resources. We suggest to increase this value if you face sluggishness or excessive use of resources.
-
Traffic animation enabled: if checked traffic flows are shown as 3D animated arrows. Otherwise, when unchecked, static 3D crest are instead used. We suggest to uncheck this value if you face sluggishness or excessive use of resources.
-
Arrows size for traffic (m): define the size of the 3D animated arrows representing the traffic flows.
-
Display road information: if checked roads retrieved from the KM4City knowledge base are shown in the map. We suggest to uncheck this value if you face sluggishness or excessive use of resources.
-
Display decoration: if checked additional 3D elements, as for example trees, are shown in the map. We suggest to uncheck this value if you face sluggishness or excessive use of resources.
-
Realistic decoration: if checked more realistic and detailed 3D models are used to represent additional 3D entities. We suggest uncheck this value if you face sluggishness or excessive use of resources.
References
-
M. Fanfani, L. A. Ipsaro Palesi, P. Nesi, "Microservices’ Libraries Enabling Server-Side Business Logic Visual Programming for Digital Twins", SoftwareX, Elsevier, 2024.
-
P. Bellini, M. Fanfani, P. Nesi, G. Pantaleo, "Snap4City Dashboard Manager: a tool for creating and distributing complex and interactive dashboards with no or low coding", SoftwareX, Elsevier, 2024. https://www.sciencedirect.com/science/article/pii/S2352711024001006 . https://doi.org/10.1016/j.softx.2024.101729
-
Lorenzo Adreani, Pierfrancesco Bellini, Marco Fanfani, Paolo Nesi, Gianni Pantaleo, Smart City Digital Twin Framework for Real-Time Multi-Data Integration and Wide Public Distribution, https://doi.org/10.48550/arXiv.2309.13394
-
L. Adreani, P. Bellini, C. Colombo, M. Fanfani, P. Nesi, G. Pantaleo, R. Pisanu, "Implementing Integrated Digital Twin Modelling and Representation into the Snap4City Platform for Smart City Solutions", Multimedia Tools and Applications, Springer, 2023, DOI: 10.1007/s11042-023-16838-0
-
Nesi, P. (2023). Smart City verso i Digital Twins. In Per una Italia che Cresca. Diversità, prossimità e generatività dei territori fra transizioni e diseguaglianze (quaderno CNEL) (pp. 403-413). CNEL, Ministero. https://flore.unifi.it/bitstream/2158/1323731/1/PaoloNesi-UNIFI-CNEL-articolo-V1-2.pdf
-
P. Bellini, S. Bilotta, E. Collini, M. Fanfani, P. Nesi, "Mobility and Transport Data for City Digital Twin Modeling and Exploitation", 2023 IEEE International Smart Cities Conference (ISC2), 24-27 September 2023, Bucarest.
-
L. Adreani, P. Bellini, M. Fanfani, P. Nesi, G. Pantaleo, "Design and Develop of a Smart City Digital Twin with 3D Representation and User Interface for What-If Analysis." In International Conference on Computational Science and Its Applications, National Technical University of Athens and University of the Aegean, Athens, Greece, July 2023. Best Paper Award
-
L. Adreani, P. Bellini, C. Colombo, M. Fanfani, P. Nesi, G. Pantaleo, R. Pisanu, "Digital Twin Framework for Smart City Solutions." In DMSVIVA 2022, The 28th International DMS Conference on Visualization and Visual Languages, KSIR Virtual Conference Center, Pittsburgh, USA, June 2022. Best Paper Award
-
L. Adreani, C. Colombo, M. Fanfani, P. Nesi, G. Pantaleo, R. Pisanu. "A photorealistic 3D city modeling framework for smart city digital twin." In 2022 IEEE International Conference on Smart Computing (SMARTCOMP), Aalto University, Espoo, Finland, June 2022.
-
L. Adreani, C. Colombo, M. Fanfani, P. Nesi, G. Pantaleo, R. Pisanu, "Rendering 3D City for Smart City Digital Twin." In 2022 IEEE International Conference on Smart Computing (SMARTCOMP), Aalto University, Espoo, Finland, June 2022.
- Genova Smart Week 2023: https://www.genovasmartweek.it/ from 25 Nov to 1st Dec., the intervention of Snap4City on Digital Twin will be the 28th of November in Genova, https://www.genovasmartweek.it/monitoraggioecontrollo/
- Smart City Digital Twin, events organized by Turku Region, Finland, 22 November in Helena, Keynote of Paolo Nesi on Snap4City. https://businessturku.fi/en/projects/smart-city-digital-twin/#WorkshopInfo
- CONVR2023 conference: http://convr2023.com/ 13-16 November, 23rd International Conference on Construction Application of Virtual Reality, Paolo Nesi, as Keynote, salone dei 500, Firenze.
The major results produced by UNIFI DISIT Lab and partners on Snap4City.org are:
- Mobility and transport DOMAIN: https://www.snap4city.org/1040
- SOLUTION: Traffic Infrastructure Optimisation: reducing travel time and emissions PDF
- SOLUTION: Traffic Light Plan Optimisation: reducing travel time, number of stops for vehicles and tramway lines: PDF
- SOLUTION: eShare in a Snap - The innovative car sharing and car pooling service, PDF
- SOLUTION Snap4City Smart Parking Manager and mobile App supports PDF
- Digital Twin Local and Global, PDF
- Key performance Indicator: KPI per la mobilità e trasporti, MaaS, parcheggi, inquinamento (ITA)
- LeverageOPTIFaaS, Operation and Plan, Transport Infrastructure and Facilities Support as a Service
- SASUAM: Solutions for Safe, Sustainable and Accessible Urban Mobility
- OPTIFaaS: Operation and Plan, Transport Infrastructure and Facilities Support as a Service
- SUMI Indicatori: definizioni e stima
- "Microservices’ Libraries Enabling Server-Side Business Logic Visual Programming for Digital Twins", SoftwareX, Elsevier, 2024. https://www.sciencedirect.com/science/article/pii/S2352711024001766
- "Snap4City Dashboard Manager: a tool for creating and distributing complex and interactive dashboards with no or low coding", SoftwareX, Elsevier, 2024. https://www.sciencedirect.com/science/article/pii/S2352711024001006 . https://doi.org/10.1016/j.softx.2024.101729
- "Smart City Scenario Editor for General What-if Analysis", Sensors, MDPI, 2024. https://www.mdpi.com/1424-8220/24/7/2225/pdf
- "Data Sources and Models for Integrated Mobility and Transport Solutions", Sensors, MDPI, 2024 https://www.mdpi.com/1424-8220/24/2/441/pdf
- High Precision Traffic Flow Reconstruction via Hybrid Method", IEEE Transactions on Intelligent Transportation Systems, 2023, https://doi.org/10.1109/TITS.2023.3329544
- Comparing techniques for TEmporal eXplainable Artificial Intelligence, 10th IEEE International Conference on Big Data Service and Applications, Shanghai, China, July, 2024.
- MOBILE MAPPING TO SUPPORT AN INTEGRATED TRANSPORT-TERRITORY MODELLING APPROACH", The International Archives of the Photogrammetry, Remote Sensing and Spatial Information Sciences, Volume XLVIII-1/W1-2023 12th International Symposium on Mobile Mapping Technology (MMT 2023), 24–26 May 2023, Padua, Italy
- see more on:

Error: __clone method called on non-object in og_user_access_entity() (line 2249 of /var/www/html/drupal/sites/default/modules/og/og.module).