
click the image to access the tool (for registered users)
Developer Dashboards is an Open Source tool for accessing to data collected (by means of ETL and IOT processes) in an interactive and faceted manner. It is based on SOLR to index the data, to enable the drill down, and to dynamically shape the data according to multiple filters. As explained in the following, this Dashboard approach is only for developers, it is not intended for Final users and neither for Dashboard of IOT applications. IOT application Dashboards are the Dashboard presented on top of the snap4city.org: https://dashboard.snap4city.org and are accessible as City Dashboard microServices Blocks into the IOT applications.
The solution is responsive, can be personalized by the final user entering in the editing mode, and dashboards:
- can be be saved on local disk
- can be set to work as automatic update
- can be saved/published on server, if authorized
- are partially suitable to serve as City Dashboard since:
- present a limited number of widgets,
- present connected data and have limitation in working with multiple data sources at the same time
- have a low capability of integrating external widgets or third parties,
- have restrictions in presenting KPI aspects belonging to different views and databases on the same dashboard. On the other hand, they be used also to show data without timeline.
Developerd dashboard: https://www.snap4city.org/kibana/app/kibana#/dashboard/c3d43c90-3401-11eb-929b-6b6f3cd2f3c9?embed=true&_g=(refreshInterval:(pause:!t,value:0),time:(from:now-7d,to:now))
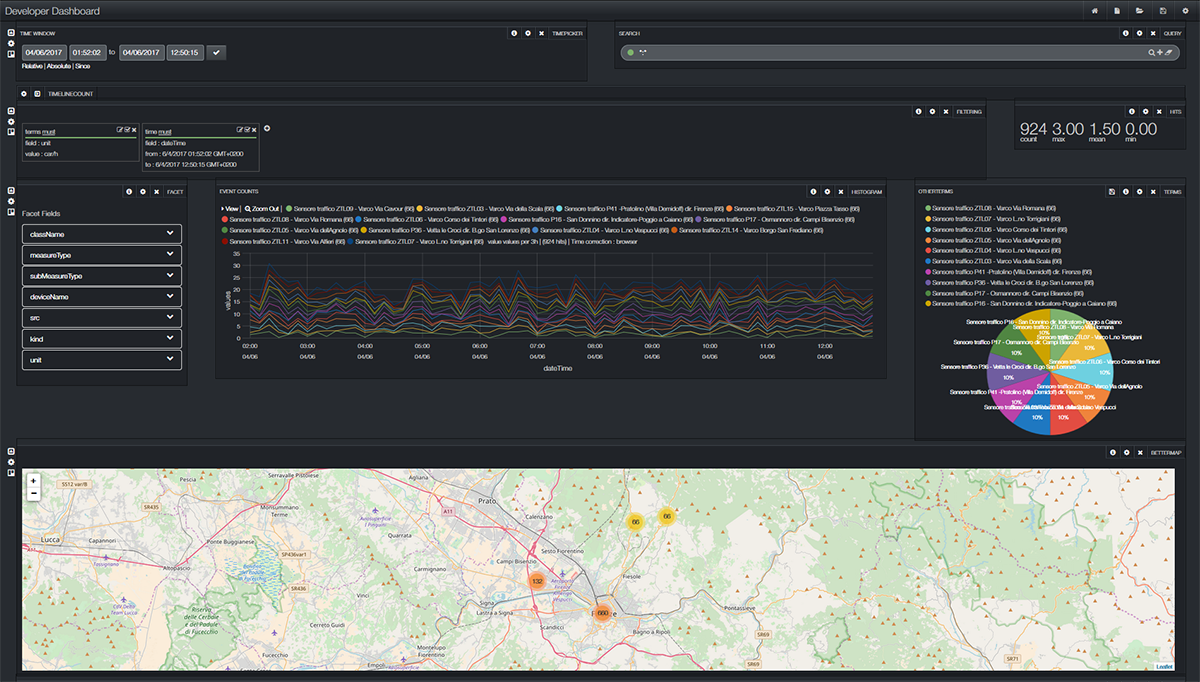
It included IOT/ETL real-time data, a mixt of fake and true positions from the Tuscany territory and Florence Smart City, IOT and ETL based. This dashboard includes the Widgets (Panel in Banana terminology) of the following Kind with their usage:
- TIMEPICKER: from to date/time. The user can identify FROM TO date/time
- QUERY: text search. The user can pose a query.
- Hidden [HISTOGRAM] with the whole distribution of measures data, to drill down on time lime. The user can see it by clicking of the show button on the left side of the bar.
- FILTERING: reporting the applied filters. The user can see the applied filters and can remove them returning to a different config, can edit them
- HIT: reporting some metrics on the selection performed by filtering. The user can ask to have more data
- FACET: a selection of facet fields, in this case: Classname, MeasureType, SubMeasureType, deviceName, SRC (ETL or IOT), kind (sensor/actuator), unit (of measure). The user can make a selection for each Facet Field, thus filtering and drilling down on kind.
- HISTOGRAM: with a counting of events along the timeline filtered, limited to XXX
- TERM: a pie in which several kinds of distribution can be shown on the basis of the Facet fields
- BETTERMAP: reporting on map the measures identified, limited to YYYYY
- TABLE: a table with data coming from the data store SOLR index, with a selection of columns.
The data to be indexed and Dashboarded for filtering, cross filtering, drill down also in timeline are:
- ETL and IOT EventLogger (log registration, subscription, etc.). micro service available and AMMA dashboard is accessible
- EventLogger is a set of services and tool to log data flow in input and outputs for the analysis on communication aspects
- IOT and ETL: Data Storage of real time data disregarding if they are collected by IOT or by ETL (a mockup is present with generated data).
- Twitter data only as an example available to demonstrate how it works on large data collection of over 300 million, for example in HUE.
Please note that some of the following links could be accessible only for registered users.
Banana Dashboards can have automated update per widget/panel according to the setting of the panel. Please note that not all the panels provide this possibility. See for an example:
- File that can be imported in the banana dashboard tool as example of developer dashbaord: https://www.snap4city.org/download/devdashboards/Dashboard1-1516469254541
- File that can be imported in the banana dashboard tool as example of developer dashbaord: https://www.snap4city.org/download/devdashboards/Dashboard1-RT-1516469284075
Banana on Data Storage of real time data:
- User Manual to download: https://www.snap4city.org/download/video/Banana_Lucidworks_User_Manual.pdf
- Step by step guide on how to create custom panels for Developers Dashbaords with commented examples: https://www.snap4city.org/download/video/CostomPanel-DeveloperDashboard.pdf