For a more complete overview please read:
- Development Life Cycle: https://www.snap4city.org/download/video/Snap4Tech-Development-Life-Cycle.pdf
- TECHNICAL OVERVIEW: https://www.snap4city.org/download/video/Snap4City-PlatformOverview.pdf
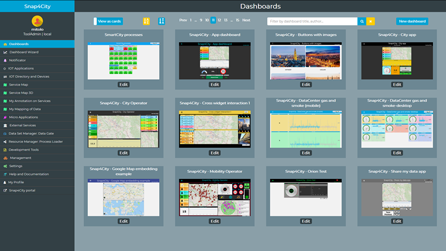
click the image to access the tool and create new Dashboards (for registered users only)
Snap4City provides two main modalities of creating dashboards, using:
- Dashboard Builder of Snap4City
- For accessing and browsing data on: Elastic Search, Mongo, MySQL, Smart City API, Super and thus from federated Smart City API, etc.
- Supports sensors/actuators: data driven data, maps in extended manner, data driven widgets, large collection of widgets, direct IoT Connections, custom widgets, animated PIN on maps, a large set of panel/widgets, etc.
- Very simple to be used for control room, decision makers, situation rooms, operators, etc.
- Very well integrated with IoT App, Custom widgets, animation, external services.
- Very simple to be customized for non programmers since all the tools are visual.
- Support for GDPR and deep control of access.
- Kibana (so called DevDash, AMMA and recently My Dashboard (Dev) Kibana ), also accessible as Grafana
- For accessing and browsing data on Elastic Search storage and other sources supported by Kibana/Grafana
- No Support for real time event driven widgets/panels, actuators and synoptics, no sophisticated maps, etc.
- Not simple for control room, decision makers, etc.
- Not integrated with IoT App, Custom widgets, animation, external services.
- Oriented to developers, complex production of custom views, etc.
- Partial support of GDPR and deep control of access.
Please start a fully guided training cases:
- HOW TO: create a Dashboard in Snap4City
- see also full training days https://www.snap4city.org/drupal/node/501
- Dashboard Manager - Technical documentation.pdf (503.83 KB)
- Dashboard Manager Db Documentation.pdf (953.71 KB)
- progetto locale con sorgenti su server remoto.pdf
- Xdebug per debug php su server remoto.pdf (74.76 KB)
The Dashboard Builder is a tool for creating Dashboards and City Dashboards for decision makers H24/7, from small to UHD monitors and more. Dashboards can be manipulated, shared, cloned, delegated, protected, etc. They are suitable for decision makers, city majors, assessors, city operators, and final users on their mobiles; and thus, suitable for massive access to the same Dashboard as in the panels at the railways stations, bus stops, etc. They do not need to be installed on the clients since they are produced as HTML5 with JavaScript. They can be embedded into third party web pages, and thus they can be used to communicate with the city users, and a simplified user interface is also provided for creating the city dashboards as IOT dashboard in IOT applications. The City Dashboards are created by composing a set of Widgets. A very large collection of them is provided. New one can be easily created by a programmer. Dashboards can show data of different kind: referral data from storage, real time data from stream and IOT devices, real time data from websocket, real time data from IOT Applications. Dashboards are connected to the data via secure protocols HTTPS, WSS, TLS, etc.
Snap4City Users of any level can easily create Dashboards in few clicks to immediately show data: last value, historical data, relationships, geo location, etc., by using the Dashboard Builder. Those Dashboards can work directly on data, IOT Devices, IOT Applications and a mixt of them, using the same tool for all Dashboards. The tool, with the Wizard, allows identifying data and service healthiness since the first phases of dashboard/widget creation/addition. One IOT Application may have more than one Dashboard, and one Dashboard may have more than one IOT Application managing its business logic.
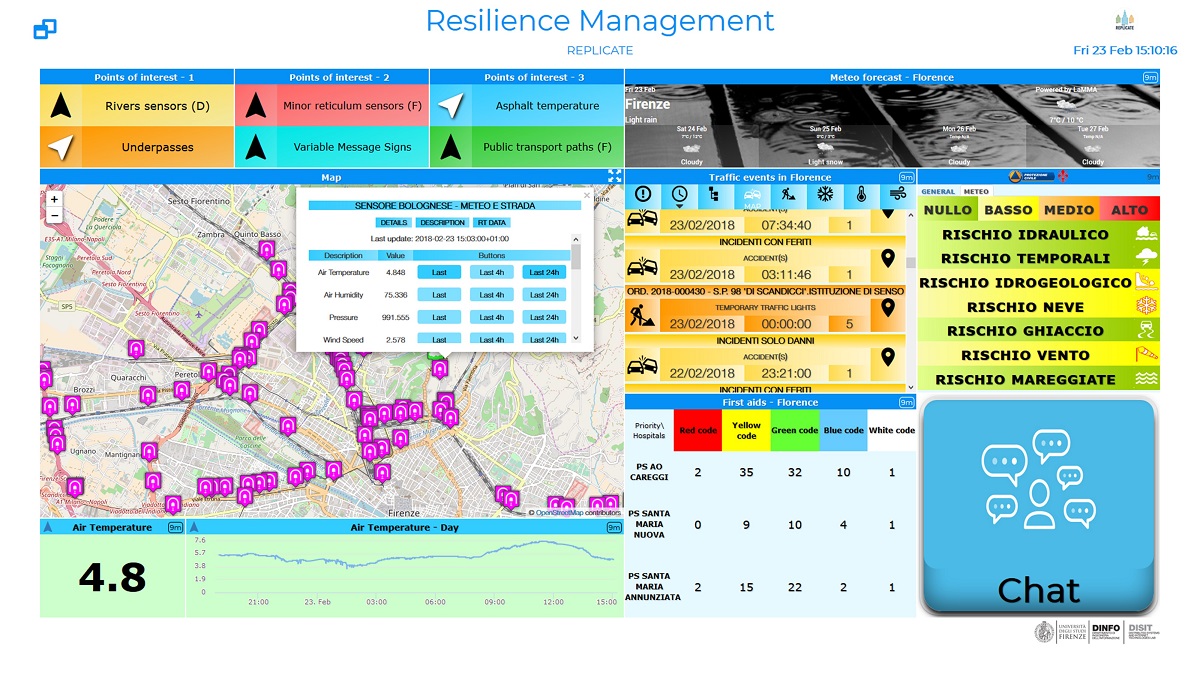
Dashboard Builder allows to show data by compositing and exploiting a large set of Widgets:
- charts, tables, time trends, histograms, maps, list, interaction elements, lists, special widgets, selector, heatmaps, Weather forecast, actuators, red light, etc., see also its usage on Https://www.km4city.org )
- including those on maps as ServiceMap/ServiceMap3D, OpenStreetMap, Google Maps, with more features and data drill down to historical data base and relationships among entities in the city.
- External Services: traffic flow reconstruction, buss tracking, Twitter Vigilance, other ServiceMaps of other cities, Km4City HTML5 Application, WiFi traking and status, etc.
- MicroApplications: search of POI, routing, search of public transport, parking forecast, pollution, pollination, first aid, etc.
The Dashboard Builder widgets are true elements of the user interface (for city dashboard and IOT applications), they can create relationships each other. One may select data for the map, another is a a real actuator for the IOT Application, other are real time view of data coming from the field in real time via WebSocket, and allow also to be directly connected to the IOT brokers, knowledge base and repositories.
The following features are covered by the dashboard builder. So that Dashboards are able to:
- show graphics by using several different kinds of visual paradigms, and parameters;
- be shown on any device of any size with dynamic resizing and full screen in a large range of browsers and devices (the autofit modality, always responsive, can be disabled and/or configured in several manners according to the developer preference);
- be shown on control room/City screens H24, 7 days per week;
- be accessed by specific users, even if, they are not users of the Control Room or operators.
- be public or limited in access to a number of qualified users. This would allow creating Dashboard for general public, and versions with sensitive data for the Civil Protection, police 118, etc.
- be of different size (e.g., PC to mobile, large screen, multiscreen) with or without main header and frame.
- show data coming from data lake, virtual store; thus, data taken from different Data Sources: SQL database, database via ODBC, noSQL database (for example MongoDB, Hbase), HDFS directly or via Phoenix, RDF stores via SPARQL, from API calls and from streaming data.
- Be composed as a set of Widgets of different size, allocated on a grid, by using a visual combination of Widgets;
- collect data and make replay of the data history from a given date and time. This feature is adopted to play back eventual critical condition and shown data;
- integrate dashboards of one or multiple IOT applications;
- provide actuators (e.g., switches, analog dimer, ..) towards IOT Brokers or directly on the IOT application, so that to close the loop with IOT applications as the user prefer.
- can be programmed to be refreshed, recollected with a given frequency; be collected autonomously even if the Dashboard in not shown in each time and day;
- collect data which can be saved or not on the Dashboard server and database.
The Dashboard builder allows to:
- quickly create new dashboard by using the wizard. The same tool can be used to ad widget to dashboards;
- set and change parameters as: size, color of the background, font of the header, color of the header, etc.;
- create and editing Dashboard produced by one or more users;
- edit controlling each single Dashboard by a single person;
- compose a set of possible views (in most cases called widgets), by visual interaction, visual composition of widgets;
- control size and zoom of the Widgets;
- allow each single dashboard to be viewed/accessed in reading by one or more specific people, access delegation;
- be cloned to derive a new dashboard from a former one and perform versioning;
- Exploit the centralized LDAP for authentication and SSO;
- Manage different types of users. The manager user can manage its own dashboards, while he/she cannot access to the general configuration settings of the tool (metrics management, widgets, users, setup). For doing that you need to be administrator.
- Be used from any kind of device, it is responsive.
The Metrics are specific selections/queries performed on some Data Source by the Dashboard builder engine, and:
- allow to take simple as well as complex data from some Data Sources: SQL database, database via ODBC, noSQL database (for example MongoDB, Hbase), HDFS directly or via Phoenix, RDF stores via SPARQL, from API calls and from streaming data;
- can be programmed to be refreshed, recollected with a given frequency;
- has to be collected autonomously even if the Dashboard in not shown in each time and day;
- collect data which can be saved or not on the Dashboard server and database. Data collected and saved from metrics can be simple (float, integer, string, date/time, etc.) but also complex data in JSON or other formats. As well as data coming from some data lake, virtual store
User Manual to download: https://www.snap4city.org/download/video/Dashboard_Management_System_User_Manual_a_smart_city_control_room_builder.pdf
In addition, specific Developer Dashboards can be and have been also created for realizing specific tools as AMMA, DevDash, Web Monitoring, API monitoring, etc. New Developer Dashboard can be easily created and shared with other developers. They are tools accessible for Developers (AreaManagers), and ToolAdministrators. Tools such as AMMA, allow their user to perform multi filter faceted search on timeline, multiclassification, geo spatial, etc., showing data on: time trends, histograms, heatmap, Origin Destination solar charts, pie, tabular, OD maps, tc.
We suggest to follow these examples and readings in the order, they are for Mobility and transport, energy, health, etc.:
- TC1.3. Accessing and using Dashboards with any device
- TC1.4. Dashboards Showing Data Real Time and Historical/trends, comparison
- TC1.5. Dashboards showing a range of different High Level Types: KPI, POI, IOT dev, MicroApp, Maps using different kind of Graphics Widget. Monitor city status with Dashboards
- TC1.6. Dashboards using different kind of graphics Widgets matching with High Level Types, Monitor city status with Dashboards
- TC1.12. Dashboard with MicroApplications
- TC4.1. Dashboard and Notificator
- TC4.6. Dashboard with city events, ESB, police, traffic, etc