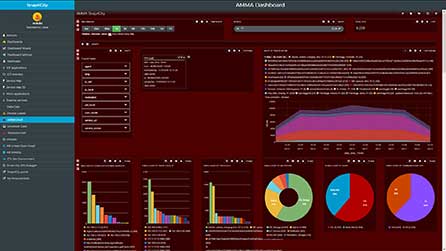
click the image to open the tool (for registered users)
The AMMA (Application and MicroService Monitor and Analyser) is an Open Source tool for monitoring and analysing communications aspects in real-time, such as data flows and volumes information among IOT, ETL and Data Analytics (in input and output, iot and storage, and API) collected by the EventLogger module in the whole solution (all ETL processes, IOT applications and MicroServices are monitored). The AMMA tool is based on SOLR index, and Banana plus special widget developed for Snap4City for accessing and displaying indexed data in an intuitive and interactive fashion, allowing applying faceted filtering and data drill down in time and space, displaying stacked data and temporal trends. The AMMA dashboard is mainly designed for developers and researchers, and presents the following main features:
- are responsive, and are simple to be created and customized by the final user entering in the editing mode;
- allow saving the dashboard on local disk and share with colleagues;
- present automatic update, programmable;
- can be saved/published on server, if authorized, and thus in the future on ProcessLoader
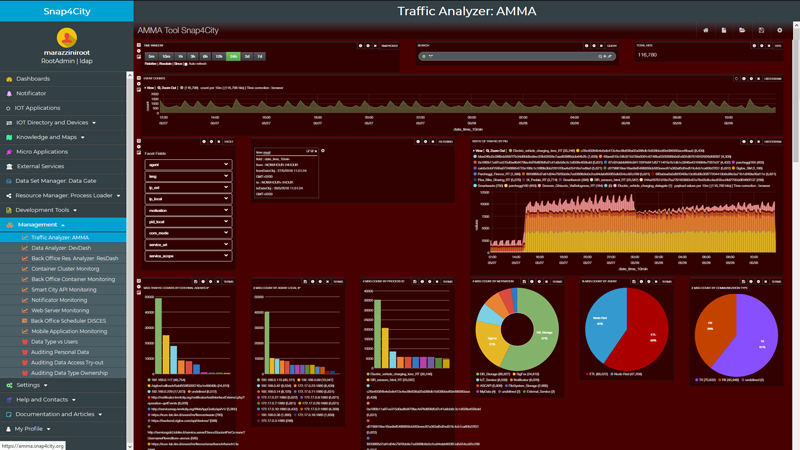
The AMMA includes data collected by the EventLogger tool, which are related to communication and data flows among IoT, ETL and Data Analytic processes. The following list describes the widgets (Panel in Banana terminology) included in this dashboard, with a brief and explanation of their usage in AMMA context:
- TIMEPICKER: date/time range selection. The user can identify FROM TO date/time;
- QUERY: text search. The user can pose a query for retrieving specific indexed data.
- HITS: reporting some metrics on the selection performed by filtering, for instance total counts.
- HISTOGRAM: counting the number of communication events and data flow events against the time selection on the timeline selected in the Timepicker widget.
- FACET: a selection of facet fields, in this case: agent (describing the type of agent, e.g.: IoT, ETL, Data Analytics); ip_local (the IP of the agent); ip_ext (the IP of the external agent to / from which the local agent is transmitting / receiving data, if present); motivation (a codified string describing the aim of a single event, for instance IoT_Service, DB_Storage, FileSysyem_Storage, Dashboard, ASCAPI, i.e., Advanced SmartCity APIcall, Eternal Services etc.); pid_local (representing the Process ID container for IoT agents or the process name for ETL); com_mode (describing if the local agent is transmitting – “TX” – or receiving data – “RX” –); service_uri (the Km4City URI of the service involved in the communication/data flow); service_scope (describing if each monitored service is Internal, that is whenever a communication occurs between local and external IPs which are both in the internal back-end architecture, or External, otherwise). The user can make a selection for each Facet Field, thus filtering and drilling down on kind.
- FILTERING: displaying the applied filters, which can be enabled, disabled or removed to allow different configurations and visualizations.
- HISTOGRAM with the stacked distribution of traffic data (it can be a measure in Kbytes or counts, according to the filter applied), to drill down on time line.
- TERMS: these are some histogram and pie charts in which several kinds of distribution can be shown on the basis of the Facet fields. For each facet field, both count message and payload traffic in KB are shown. In this case the following Facet Fields are monitored: motivation, agent, communication type and service scope in six pie charts; eight histogram graphs represent the local IP and the external IP of the most engaged agents, the most instantiated process kinds, as well as the Km4City Uri of the most engaged services.
- HEATMAP: This is a heatmap for representing the count message values between ip_local and ip_ext of monitored data records. These values are mapped against a grey scale colour array.
- SUNBURST: the Sunburst representation is a multi-level ring/pie chart which allows to easily visualize multi-level faceting diagrams, depending on the faceting input order. In this case, such a widget has been considered very useful to provide a powerful representation of Origin/Destination of local and external IPs, on the basis of different facet fields. However, in order to be suitable for data traffic monitoring, the widget has been customized in order to provide sum values statistics, and not only count values (see Example 3 in test case TC3.5 for further details on Sunburst panel customization and usage). Sunburst charts are also very useful for the purpose of applying more than one facet filter at time, allowing a very deep level of drill-down on faceted data.
- SMARTCITYMAP: this is a newly created panel (see Example 2 in test case TC3.5 for further details on implementation and usage) which has been realized and made available from Banana panel configuration, in order to show service URIs enriched with additional information (service details, description and real-time data visualization, if available) retrieved by calling the SmartCity API. Thus, a full integration (both on data and visualization style) has been reached with the map widgets built by using the Dashboard Builder.
- TABLE: a table with data coming from the SOLR index, with a selection of columns and the possibility to order by column values. The “service_uri” field is now treated as a clickable web link, pointing to a page showing the service details as an instance of the Smart City Knowledge Base (showing properties and attributes in the form of Smart City ontological triples). Therefore, it is now possible to pass from real-time data to the Knowledge base description and context.
EventLogger: and event-driven loggging tool to collect events monitoring data flow traffic and other events. It Is based on Rsyslog logging protocol. MicroServices as called and exploited in IOT, ETL and Data analytics applications can log their data flow activities and communication events by calling dedicated API by means of specifically designed NodeRED and ETL blocks. For further reference, the EventLogger API are described and detailed in the Appendix of the testing document.
Please note that some of the following links could be accessible only for registered users.
The AMMA dashboard is accessible at the following URL: https://amma.snap4city.org
Also accessible as direct link as: https://amma.snap4city.org/solr/banana/#/dashboard/solr/AMMA%20Snap4City5?server=%2Fsolr%2F
The AMMA tool is based on SOLR to index data, and Banana as a GUI for accessing and displaying indexed data in an intuitive and interactive fashion, allowing applying faceted filtering and data drill down, displaying stacked data and temporal trends.
- File containing an AMMA dashboard that can be imported in the AMMA Banana based dashbaord tool: https://www.snap4city.org/download/devdashboards/AMMA%20Snap4City-1518811725004
- User Manual of Banana for Developers: https://www.snap4city.org/download/video/Banana_Lucidworks_User_Manual.pdf
- Step by step guide on how to create custom panels for Developers Dashbaords with commented examples: https://www.snap4city.org/download/video/CostomPanel-DeveloperDashboard.pdf