|
Test Case Title |
TC1.19 - Creating and Exploit heatmaps for Dashboards and as reference data services |
|
Goal |
I can:
|
|
Prerequisites |
Accessing to IOT Applications and developing them. To know how to create dashboards. Accessing to data that can be heatmapped. |
|
Expected successful result |
See the heatmaps on dashboards, see the animated heatmap animating those of the current day, picking a value associated with a an heatmap. |
|
Steps |
The heatmap can be of different kind. They can be:
- A) type: scattered set of GPS points in which a Value is reported regarding density, numerosity, temperature, humidity, etc.
- B) type: dense in the sense that in a certain regular grid (not necessary squared) along latitude and longitues a number of points GPS are reporting Values
In both casesl; A and B, the heatmaps may be represented in different manners and overimposed on the map. These modalities assumes that Each point is coloured with a color according to the Value of the point:
- GUSSIAN Model: arount the point the color is faded towards other colors depending on the distance from the point. This approach may create some mistakes since the Value is known only in the point and nothing is known about the value around it. In those representations the fading can be tuned to be smooth or sharp, light or darker, etc.
- DENSE Model: arount the point, the color is identical to that of the point, for a squared area around the point.
In Snap4City, Heatmaps can be generated in A and B modalities and can be represented by GAUSSIAN and/or DENSE models overimposed to the maps on dashboards. In Snap4City, most of the heatmap loaded in terms of data (as a sequence of points) are loaded into the Heatmap manager via API and can be visualized in both GAUSSIAN or DENSE by usign a range of color maps. DENSE Model heatmap are generated as GEO TIFF images and are provided to the Dashboard manager by means of WMS protocol from a GeoServer of Snap4City.
1. create Heatmaps of different kinds
The creation of Heatmap can be performed in RStudio, ETL or IOT Applications.
please read to know HOW TO: produce heatmaps, custom heatmaps on any data
The meaning of parameters and algorithm for computing the heatmap is described in https://www.snap4city.org/457
and https://www.snap4city.org/641
The created heatmaps can be stored into the HeatMap Server by using specific API: https://www.km4city.org/swagger/external/index.html?urls.primaryName=Heatmap%20API
The Snap4City tools also provide MicroServices to be used into IOT Applications to generate Heatmap on the basis of some variable for example: temperatura, humidity, PM10, PM2.5, SO2, CO, Co2, Benzene, O3, H2S, density of Clicks, safer area, density of people, etc.
According to the API, each heatmap has: (i) a set of metadata, including type A or B, (ii) a set of points with values, (iii) a color map of reference.
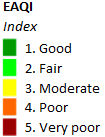
2. create heatmap with custom Color Maps, create Color Maps
An Heatmap need to have a Colormap since its frist upload to work. A color map is a set of colors and bounds simialr to what is presented in the next figure for EAQI. The figure reports the Color map as depicted into the Color map Editor. On the other hand, each heatmap also need of an ICON to depict the legenda on the MAP aside. Please note that in Snap4City, colo maps can be based on a small set of color as well as a long set of them, to create a Dense Color map for nicer fading effects.
 |
 |
3. visualize Heatmaps on Dashboards, animate heatmaps on dashboard for the whole day data, navigate on sequences of heatmaps over time
A good example of how the HeatMap can be visualized can be:
- GAUSSIAN:

- DENSE: www.snap4city.org/dashboardSmartCity/view/index.php?iddasboard=MTQwNg==">https://www.snap4city.org/dashboardSmartCity/view/index.php?iddasboard=MTQwNg==" target="_blank">www.snap4city.org/dashboardSmartCity/view/index.php?iddasboard=MTQwNg==">https://www.snap4city.org/dashboardSmartCity/view/index.php?iddasboard=MTQwNg==

please read to know HOW TO: produce heatmaps, custom heatmaps on any data. www.snap4city.org/drupal/node/641">https://www.snap4city.org/drupal/node/641">www.snap4city.org/641">https://www.snap4city.org/641
4. query heatmap to get a value in each specific point on the map, query Smart City API heatmap service to get the value at specific GPS coordinates
Once the heatmap is visualized on Dashboard, it can be queried to know the valu is each specific point by a simple click with the mouse. This activity is performed by querying to the Heatmap API mentioned above, by means of which one can get access to the data on the Heatmap manager.
5. HeatMap Manager: manages my heatmap collection, and manage the Color maps
The Heatmap manager is capable to manage the collection of Heatmap, their values over time. In fact on the dashboard is possible to see next and prev heatmap of the sequence. In most cases, the heatmap are periodically estimated, for example once per hour, a time every 2 hours, etc. To this end, the Heatmap manager has a view about the Heatmap collection, and for each heatmap a list of instances produced at their own date and time. Please not that the Heatmap may represent data on the future. For exampel for ENFUSER, for GRAL on the above example.

6. creation of heatmap on dashboards,
The Heatmaps are a HighLevelType, this means that once they are created, they can be used to create Dashboards. The user may find them into the Dashboard Wizard, and selecting them, they can be listed in some selector and shown on the Selector Map New. The results is that observed above.
please read to know HOW TO: produce heatmaps, custom heatmaps on any data: www.snap4city.org/drupal/node/641">https://www.snap4city.org/drupal/node/641 " target="_blank">www.snap4city.org/641">https://www.snap4city.org/641