Thumb Rules on Snap4City for High Level Type and data types in general.
When in Snap4City is talking about Modelling is referring to Defining and Modelling Entity Models.
A large number of other data types are also managed as follows.
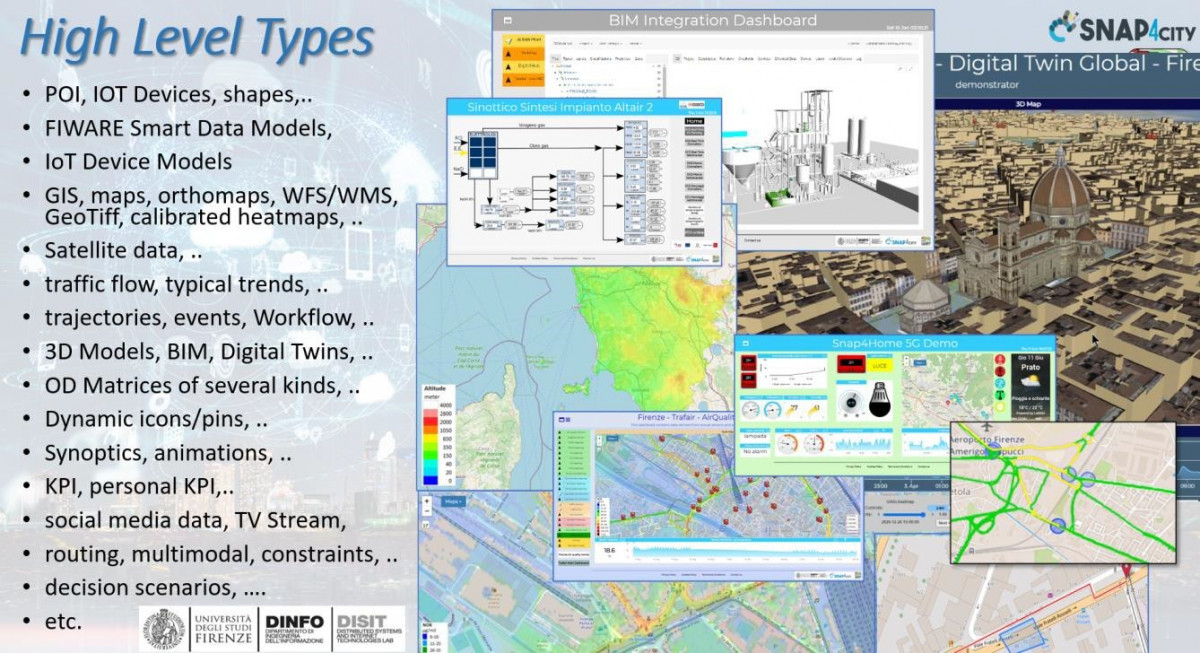 Figure: high level types, example.
Snap4City has the concept of High-Level Type, that are unified with a Unified Data Model. The HLT are the collection of all data kinds of data formats supported by Snap4City system and are listed from the Data Inspector, and in the Dashboard Wizard.
They are grouped by categories as follows:
- Devices/Entities and their model and variables (Managed from IoT Directory):
- Entity Model (IoT Device Model), Entity Instance (IoT Device), Entity Variable (IoT Device Variable) (managed by IoT Directory)
- Entity Models can be derived from FIWARE Smart Data Models
- Mobile Entity Model (Mobile Device Model), Mobile Entity Instance (Mobile Device), Mobile Entity Variable (Mobile Device Variable) (managed by IoT Directory) The difference with the previous is the possibility for them to move (change GPS) and thus render them on trajectories, track for fleets and sensors, let’s say time series moving over time.
- Entity Models can be derived from FIWARE Smart Data Models
- Data Table Device, Data Table Model, Data Table Variable (managed by IoT Directory and produce by Data Table tool). They are produced by the Data Table Loader or POI Loader automated processes for loading data and generating their models and devices, which automatically produce the model, devices, and instance messages over time, let say time series.
- BIM devices are actually Entity Instances (managed by BIM Manager accessible into the Dashboard Wizard), that refer to some BIM View, and the BIM manager may refer to some BIM Views in which the Entity Instance.
- Files devices are actually Entity Instances (managed by the File Manager from Data Management)
- Sensor, Sensor Device, Sensor-Actuator (deprecated since all the IoT Devices can be both sensors and actuators). They are produced by formers ETL processes, similar to the concept of device and variable (Sensor Device, Sensor). In the present version of Snap4City, all sensors are actually modelled as sensors-actuators.
- Entity Model (IoT Device Model), Entity Instance (IoT Device), Entity Variable (IoT Device Variable) (managed by IoT Directory)
- KPI, key performance indicator single variables (Managed from Data Management, HLT):
- MyKPI (managed by MyKPI manager from Data Management) they are all personal data produced by IoT App, Mobile App, or loaded from some process. MyKPIs are mainly used for trajectories, for saving single values time series. They can be: (i) used for long-term saved and retrieved from Proc.Logic / IoT App, (ii) saved on MySQL or Open Search according to a setting, (iii) used as event-driven for synoptics, (iv) created via the MyKPI management via the graphic user interface.
- My Personal Data, MyData (the latter are mainly deprecated). The former are used to save user profile information such as password of hash, scenarios, etc.
- My POI (mainly managed as Entity Models). They are static point of interest that can born private and then made public when approved. POI are used for marking Points of Interest on maps (museums, banks, schools, parks, etc.), they are points of attractions without time changing variables, without time series and with a relevant number of metadata: web page, email, time of opening, etc. They could be also generated as Devices, see for instance POI Loader. MyPOI are personal POI, which can be created from a Mobile App. The administrator can leverage a MyPOI to a general POI.
- KPI: deprecated HLT
- Map features and tools in addition to all the above data which can be located on map (Managed from Data Management, HLT), also:
- Heatmap (managed by Heatmap manager from Data Management) they are produced by some data analytics or directly loaded on the Heatmap Server. They can be shown on a map, and picket if loaded correspondingly. Some of the heatmaps can be computed on the client (non-calibrated), the others are generated to produce dense and regular maps calibrated according to a Color Map standard (see Color Map Manager). The latter is distributed by the GeoServer via WMS/WFS protocol and can be animated in 24 hours if instances over time are present.
- Traffic Flows (managed by Traffic Flows manager from Data Management) they are typically produced from a traffic flow reconstruction algorithm to generate data in terms of Polyline JSON and loaded on Traffic Flow Manager which converts them into geo images for the GeoServer which distributes them via WFS/WMS. They can be time series of data to be used for showing animations daily of the traffic flow on the map.
- Traffic Flow PolyLine: they are produced from traffic flow reconstruction data in terms of Polyline JSON and can be used for rendering on 3D City Digital Twin as crests, on a 3D map. They can be time series of data.
- OD Matrix (managed by OD Matrix manager from Data Management). They are produced from some original data, census data, cell phone, data, mobile data, etc., and loaded in terms of OD data on the OD Manager/server for distribution on map. They can refer to different geo areas, grids, ace, regional administrative shapes, etc. They can be time series of data, inflow and outflows, etc.
- Tools: what-if, scenarios, etc. (as tools accessible into the Dashboard Wizard) They can be shown on the Multi Data Map on the dashboard and are
- Scenario: for creating critical scenarios blocking a part of the city, multiple unconnected areas and for multiple time slots. Scenarios can be saved and shared with other operators.
- What-if: for exploiting a scenario and deciding routing and solutions to be taken for private routing. The resulting cases can be saved to be shared with other operators.
- WFS (WMS, etc.), for connection to GIS for images, maps, orthomaps, shapes, POI, PIN, etc.
- 3D models of the City, Global Digital Twin. They are generated with a suite of tools starting from Lidar, GIS shapes, facades images, orthomaps images, etc.
- Trajectories, Paths, shapes, etc. they are produced from some original data or some data analytics, or routing, or paths. They can be sent to the map for visualization. Some segments of the Trajectory can be requested to the composed by a new routing.
- Third party html pages and tools, only for Dashboard Widgets
- External Service (managed by the External Service Manager) they are websites which registered on Snap4City.org and can be rendered into an Iframe of the Dashboard if they allow to do it. Some restrictions may be applied by the owner of the Web Sites.
- Synoptics (managed by the Synoptics Manager from Extra Dashboard Widgets) they are special modules provided by Snap4City grounded on SVG format for rendering in real time graphics layouts of energy plat, industrial plants, metro stations, etc. They may present several IoT Device Variable, Constants and MyKPI in event-driven data. They can also provide interactive elements by which the user can send data, and actions to the platform, writing to MyKPI, using the IoT App. Synoptics are instantiated based on a model which can be generated according to guidelines.
- MicroApplications (managed by the MicroApplications Manager from Extra Dashboard Widgets) they are Web Applications developed by Snap4City as micro solutions, micro applications solving specific cases and rendered into an Iframe of the Dashboard.
- BIM View for single building and areas (managed by BIM manager from Data Management)
- BIM View: are used to represent and show a 3D building, floor or segment derived from some IFC format for BIM. They are collected and provided by the BIM Manager.
- BIM Device: are IoT Devices used to represent and show a 3D building, floor or segment with a specific IoT Device, ServiceURI, POI attached. They are derived from some IFC format for BIM, collected and provided by the BIM Manager, while the BIM editor permits to attach the ServiceURI to the BIM corresponding element.
- TV Cam (managed by TV Cam Manager from Data Management), they are a specialized Entity Model and Entity Instances. So that, they have GSP location, nature Subnature, variable, etc., plus credentials to access at the protected video stream. They get video streams on RTSP, ONVIF modelled as Entities / Devices. They can be defined and managed by the TV Cam manager, in which it is possible to define protocol and access data. The visualization is performed on WebRTC protocol via Kurento on a special Widget.
- Other HLT and Widgets:
- Dashboard-IOT App: representing the data flow, even driven from Proc.Logic / IoT App to Dashboards and vice versa. They can be intercepted and exploited.
- Special Widget: several special widgets have been created to show specific HLT, for example the
- weather forecast, civil protection,
- quality of public transport,
- status of a specific decision support system process,
- first aid, clock,
- Twitter Citations, and Twitter Hashtags.
- Complex Event: to represent events of different kinds on specific Dashboard Widgets: entertainment events, critical events, operator events, traffic accidents, etc. In the short future, a new version of the Event Device and Event Table Widget will be finalized to deprecate this former HLT with a set of more flexible solutions.