
Welcome to the Malta on Snap4City.
The Golden Bay, located on the northwest coast of Malta within the Mellieħa and Mġarr localities, is renowned for its stunning natural landscapes and rich biodiversity. This area, known as Rdumijiet ta’ Malta: Ramla tal-Mixquqa, spans approximately 33 hectares and includes diverse environments such as clay slopes, beaches, karstland, boulder screes, and agricultural land. Protected under the Natura 2000 management plans since 2017, Golden Bay aims to conserve its unique ecological characteristics.
The area's natural features make it a popular destination, particularly during the summer months when tourists flock to its sandy beaches, such as the picturesque Ramla tal-Mixquqa and the adjacent Ramla ta Ghajn Tuffieħa. Despite its popularity, Golden Bay faces challenges such as seasonality, overcapacity tourism streams, excessive construction, waste generation, resource depletion, desertification, erosion, and biodiversity loss.
The following dashboards are available.
 |
 |
 |
 |
 |
 |
 |
The main functionalities of those dashboards are described below.
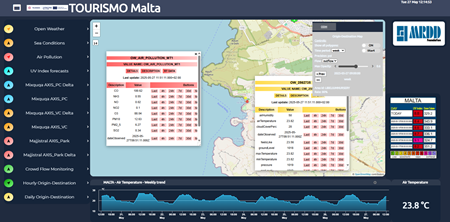
The main dashboard TOURISMO Malta is divided in three main areas:
- A selector on the left that allows to activate/deactivate the visualization of data on the map. The popup on the sensor is responsible for controlling the visualization on the time-trend under the map.
- The map representing the geographic area
- The widget on the bottom part, below the map, with a single content showing the last value of a selected data, and a time trend widget representing the temporal data in a particular time period.
- On the right, redirection buttons are available for the “People Counting” and “Maquqa Data” dashboards, containing data from sniffer devices and summarized time trend data from cameras, respectively. The “Live Stream Beach” button provides access to the live Mixquqa beach camera monitoring, while the “Documentation” button links to this webpage. Also a specific widget showing the UV Index and Ozone column forecast data is on the right of the dashboard.
Also a specific widget showing the UV Index and Ozone column forecast data is on the right of the dashboard.
The selector allows to shown/hide the following data represented as pins on the Map or activating specific advanced functionalities in the Malta Main Dashboard::
- Open Weathers: activate/deactivate the pins on the map representing the geographical position of the open weather sensors measuring weather data. By clicking the pin on the map a pop up is shown representing all the data measured by the sensor (i.e. air temperature, air pressure, air humidity, etc.).
- For each of the variable shown in the pop up in the column “Description”, it is possible to click on specific buttons (Last value, last 4 hours, last 24 hours, last 7 days, last 30 days, etc.) to see respectively the last value and the historical data represented in the widgets below the map.
- Sea Conditions: activate/deactivate the pins on the map representing the geographical position of the open weather data representing sea conditions. By clicking the pin on the map a pop up is shown representing all the data measured (i.e. wave direction, wave height, wind wave direction and height, etc.).
- For each of the variable shown in the pop up in the column “Description”, it is possible to click on specific buttons (Last value, last 4 hours, last 24 hours, last 7 days, last 30 days, etc.) to see respectively the last value and the historical data represented in the widgets below the map.
- Air pollution: activate/deactivate the pins on the map representing the geographical position of the open weather sensors measuring air pollution. By clicking the pin on the map a pop up is shown representing all the data measured by the sensor (i.e. CO, PM10, PM2.5, NO, NO2, etc.).
- For each of the variable shown on the pop up in the column “Description”, it is possible to click on specific buttons (Last value, last 4 hours, last 24 hours, last 7 days, last 30 days, etc.) to see respectively the last value and the historical data represented in the widgets below the map.
- UV Index forecasts: showing data regarding UV index of the day and the forecast for the next days;
- Mixquqa AXIS_PC: the cumulative number of people entering and exiting, monitored by the AXIS camera at the beach location during the day.
- Mixquqa AXIS_PC Delta: The difference between the actual measurements with respect the previous one, in accordance with Mixquqa AXIS_PC. For example, Delta for “inHuman” is the difference between the actual measurement of "inHuman" with respect to the previous one with the frequency of 5 minutes.
- Mixquqa AXIS_VC: the cumulative number of vehicles and people entering and exiting, as monitored by the AXIS camera on the street near the beach location during the day.
- Mixquqa AXIS_VC Delta: The difference between the actual measurements with respect the previous one, in accordance with Mixquqa AXIS_VC. For example, Delta for “inCar” is the difference between the actual measurement of "inCar" with respect to the previous one with the frequency of 5 minutes.
- Majjistral AXIS_Park: the cumulative number of vehicles and people entering and exiting, as monitored by the AXIS camera on the Majjistral Park location during the day.
- Majjistral AXIS_Park Delta: The difference between the actual measurements with respect the previous one, in accordance with Majjistral AXIS_Park. For example, Delta for “inCar” is the difference between the actual measurement of "inCar" with respect to the previous one with the frequency of 5 minutes.
- Mixquqa Density Analysis: real-time analysis of people “occupancy ”, “density” and “humanSpace” at the beach, providing the current number of people present, the percentage relative to the maximum occupancy, and the available square meters per person. Occupancy – providing the current number of people present at the beach (in minus out), indicating the line of 1060 people as the recommended occupancy when assuming a fixed BeachArea = 7,210 m² and personalSpace = 6.8 m² per person (according to EU standards).
Personal space = the available square meters per person. These values are calculated based on the occupancy, defined as: Occupancy = BeachArea / personalSpace
The dashboard TOURISMO Malta – Mixquqa Live Webcam provides access to the live Mixquqa beach camera monitoring.
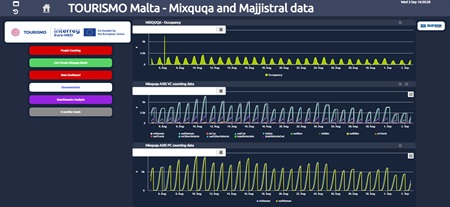
The dashboard TOURISMO Malta – Mixquqa & Barracks Counts
- Mixquqa and Majjistral Barracks People and Vehicle Counting data:
- Mixquqa AXIS_PC: the cumulative number of people entering and exiting, monitored by the AXIS camera at the beach location during the day.
- Mixquqa AXIS_PC Delta: The difference between the actual measurements with respect the previous one, in accordance with Mixquqa AXIS_PC. For example, Delta for “inHuman” is the difference between the actual measurement of "inHuman" with respect to the previous one with the frequency of 5 minutes.
- Mixquqa AXIS_VC: the cumulative number of vehicles and people entering and exiting, as monitored by the AXIS camera on the street near the beach location during the day.
- Mixquqa AXIS_VC Delta: The difference between the actual measurements with respect the previous one, in accordance with Mixquqa AXIS_VC. For example, Delta for “inCar” is the difference between the actual measurement of "inCar" with respect to the previous one with the frequency of 5 minutes.
- Majjistral AXIS_Park: the cumulative number of vehicles and people entering and exiting, as monitored by the AXIS camera on the Majjistral Park location during the day.
- Majjistral AXIS_Park Delta: The difference between the actual measurements with respect the previous one, in accordance with Majjistral AXIS_Park. For example, Delta for “inCar” is the difference between the actual measurement of "inCar" with respect to the previous one with the frequency of 5 minutes.
- Mixquqa Density Analysis:
1) real-time analysis of people “Occupancy”, providing the current number of people present at the beach. (In pax minus out pax; with the recommended occupancy being around 1060 when assuming a fixed BeachArea = 7,210 m² and the EU average of personalSpace = 6.8 m² per person. 1,803 if assuming 4m² per person.
2) real-time analysis of “humanSpace” at the beach, indicating the available square meters per person. These values are calculated based on Human Space = BeachArea / Occupancy.
- The dashboard TOURISMO Malta –Last 30-day Counts contains the monthly data trends from data cameras devices and the Mixquqa beach and Majjistral park for comparison. A specific period can be selected by entering a date in the calendar in the top left corner.
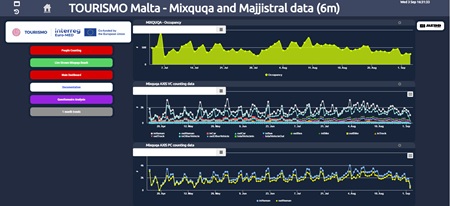
- The dashboard TOURISMO Malta – Last 6-month Counts contains the data trends (daily avarage) of the last 6 months from data cameras devices and the Mixquqa beach and Majjistral park for comparison. A specific period can be selected by entering a date in the calendar in the top left corner.
The TOURISMO Malta – Mixquqa Monthly Trends dashboard displays key indicators related to beach attendance, including total visitor counts, vehicles counts, and peak day during the mouth. All metrics are presented for the current month as well as for previous months.
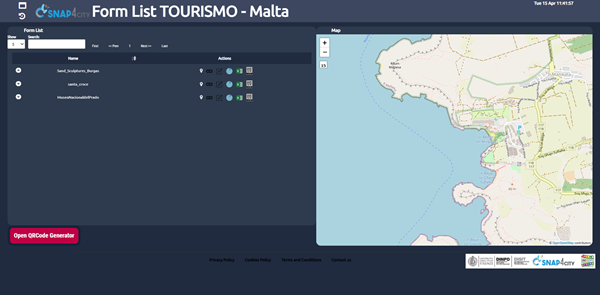
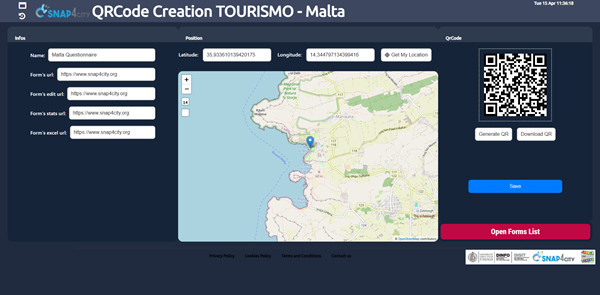
The webpage TOURISMO Malta –Sentiment Analysis provides a summary, generated by a Large Language Model (LLM), of the results obtained from the analysis of user satisfaction based on a questionnaire. The responses were collected through the Engaging City Users service, accessed via QR Code, as part of the TOURISMO project (https://www.snap4city.org/1081).
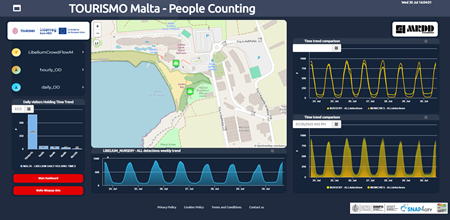
The dashboard TOURISMO Malta – Mixquqa WIFI-BT Counts, which contains data from sniffer devices, is divided in three main areas:
- A selector on the left that allows to activate/deactivate the visualization of data on the map. The popup on the sensor is responsible for controlling the visualization on the time-trend under the map. On the left, the “Daily visitors Holding Time Trend” and redirections buttons are also present. “Daily visitors Holding Time Trend” is a Bar plot reports the number of visitors distribution regarding the holding time based on the ranges: <1h, 1-2h, 2-4h, 4-8h, 8-12h, respectively. The update of the values on the device happens automatically each day at 23:30.
- The map representing the geographic area.
- The widget on the bottom, below the map, with a single content showing the last value of a selected data, and a time trend widget representing the temporal data in a particular time period.
- On the right, the weekly trends of people data collected by sniffers are displayed and compared. A specific period can be selected by entering a date in the calendar in the top left corner.
The selector allows to shown/hide the following data represented as pins on the Map or activating specific advanced functionalities in the Pilot Main Dashboard:
- Crowd Flow Monitoring: people flow monitoring via sniffers. The pin and the visualization shows the sensors data information such as the last number of sniffed visitors both Wifi, BLE or both. The popup on the sensor is responsible for controlling the visualization on the time-trend under the map. This data are used for the generation of Origin Destination Matrices;
- Hourly OD: Origin-Destination Matrices generated every hour;
- Daily OD: Origin-Destination Matrices generated every day.
Hourly OD and Daily OD open a tab on the top right corner of the map with some setting and control to:
- Switch the time period between week to months and viceversa;
- Switch the data between inflow and outflow;
- Modify the opacity of the ODM;
- Move back and forward changing the date of the data to be shown.
In the ODM, the blue area represents the area of interest that has been selected. The coloured areas represent the inflow/outflow data to/from the selected area in percentage. The color of the areas are represented according to the colormap shown on bottom left in the map.
The TOURISMO Malta – Forecasting dashboard provides an automated approach for configuring and visualizing forecasts related to different measures. The left side allows the selection of the available devices for which predictions can be generated, while the right side is dedicated to the configuration of the forecasting parameters.
When a device is selected from the map, the configuration form is automatically updated to reflect the chosen device. The metric to be forecasted can then be selected, together with the forecasting model, either LSTM or Prophet. The Prophet model is recommended for sustainability reasons, as it can adapt to the observed data trend without requiring retraining. The configuration also includes the definition of the start date, which specifies the temporal starting point of the forecast, the prediction rate, expressed in minutes and representing the temporal resolution of each forecast step, and the slot number, which defines the total number of forecast steps to be generated from the selected start date.
After all required parameters have been configured, the computation is initiated by pressing the Submit button. Once the process is completed, the trend chart displayed below the map displays both the historical data of the selected metric and the corresponding forecast produced by the selected model. To use the forecasting tool, users must access the platform using a Snap4City account.
Additional information on
- TOURISMO Webpage on Snap4City
- Project web site: https://tourismo.interreg-euro-med.eu
- https://www.facebook.com/profile.php?id=61557381137979
- https://www.linkedin.com/company/tourismoproject/
Project kind: Interreg Euro-MED, cofounded by the European Union