This dashboard has been created to provide an instrument to City Officers and Experts about environmental, weather, and traffic aspects of the city. The users can pass from the overview to see specific data and piking values in specific points of the map as he/she prefers. See aslo the special views at higher resolution/density. The dashboad has been produced by Snap4City team, you can find more and more information on Https//www.snap4city.org
https://www.snap4city.org/dashboardSmartCity/view/index.php?iddasboard=MjE5MA==
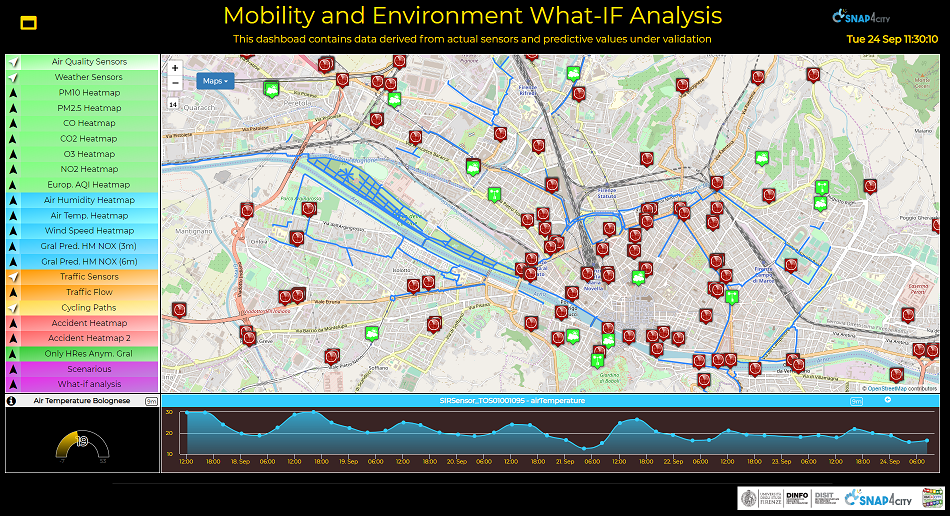
On the MAP:
- MAP: allows you to change the background map and to superimpose other view on the same map
- other widgets for interation appear on the map according to the specific service recalled.
ON THE LEFT SELECTOR
- Air Quality Sensors: PINs about the location of air quality sensors (see below for what you can do on the pin for showing data, and drill down on the several data associated with sensors).
- Weather Sensors: PINs about the location of weather sensors (see below for what you can do on the pin for showing data, and drill down on the several data associated with sensors).
- PM10 heatmap: real time heatmap of pollutant levels in air in terms of PM10 (measured in µg/m3) particles in the area. The heatmap is updedd every 2 hours. On the Heatmap Controls widget: the animated values of the entire 24 hours are available, as well as with "Prev" button the past heatmaps.
- PM2.5 heatmap: real time heatmap of pollutant levels in air in terms of PM2.5 (measured in µg/m3) particles in the area. The heatmap is upded every 2 hours. On the Heatmap Controls widget: the animated values of the entire 24 hours are available, as well as with "Prev" button the past heatmaps.
- CO heatmap: real time heatmap of levels in air in terms of CO (measured in µg/m3) particles in the area. The heatmap is upded every 2 hours. On the Heatmap Controls widget: the animated values of the entire 24 hours are available, as well as with "Prev" button the past heatmaps.
- CO2 heatmap: real time heatmap of levels in air in terms of CO2 (measured in µg/m3) particles in the area. The heatmap is upded every 2 hours. On the Heatmap Controls widget: the animated values of the entire 24 hours are available, as well as with "Prev" button the past heatmaps.
- O3 heatmap: real time heatmap of pollutant levels in air in terms of ground-level ozone (O3 measured in µg/m3) in the area. The map is upgraded every 2 hours .
- NO2 heatmap: real time heatmap of pollutant levels in air in terms of nitrogen dioxide (NO2 measured in in µg/m3) in the area. The map is upgraded every 2 hours.
- EAQI heatmap: real time heatmap of European Air Quality Index. The resulting index from 1 to 5 indicate the quality of air. Please read https://www.snap4city.org/drupal/node/435 for the definitions of the measured and computed values.
- Air Humidity Heatmap: real time heatmap of the air humidity in the area. The heatmap is upded every 2 hours. On the Heatmap Controls widget: the animated values of the entire 24 hours are available, as well as with "Prev" button the past heatmaps.
- Air Temp heatmap: real time heatmap of the air temperature in the area. The heatmap is upded every 2 hours. On the Heatmap Controls widget: the animated values of the entire 24 hours are available, as well as with "Prev" button the past heatmaps.
- Wind Speed heatmap: a real time heatmap comuted on the basis of the wind intensity.
- Gral pred. HM NOX (3m): heatmap of NOX (NO, NO2) particles hourly predictions in µg/m3 measured 3 meters on the ground and computed using Gral model. The predictions related to the entire 24 hours are available, clicking on the "Next" button on the Heatmap Controls widget you can see the forecast. (data prediction under calibration)
- Gral pred. HM NOX (6m): heatmap of NOX (NO, NO2) particles hourly predictions in µg/m3 measured 6 meters on the ground and computed using Gral model. The predictions related to the entire 24 hours are available, clicking on the "Next" button on the Heatmap Controls widget you can see the forecast. (data prediction under calibration)
- Traffic Sensor: PINs about the location of traffic sensors, from which you can see the values measured on traffic sensors, and drill down on the several data associated with sensors. They are used for the traffic flow reconstruction.
- Traffic Flow: the traffic flow depicted has been reconstructed on the basis of the data collected by the sensors computing the flow every 20 meter. You have to reload them every time you change resolution by zoom. The flow has been estimated by using DISIT lab traffic flow reconstruction algorithm based on partial differential equation. It is continuosly computed every 15 minutes, and the machine learning performed every 15 days. it includes Florence and also Fi-Pi-Li main road for the coast. other direct views can be obtained from https://www.snap4city.org/dashboardSmartCity/view/index.php?iddasboard=MTc5NQ==
- Cycling paths: view of the cycling paths in the city
- Accident Heatmap: an heatmap reporting the distribution of the accidents happened in Florence in the last 3 months. Gaussian method
- Accident Heatmap2: an heatmap reporting the distribution of the accidents happened in Florence in the last 3 months. calibrated method
- Only HRes Anym. GRAL: to activate this view you have to click and select the animation H24 button. Please wait, the high resolution version of the "Gral pred. HM NOX (3m)" is shown, please wait, you can pan and zoom the animation as you like. (data prediction under calibration)
- Scenarious: this service allows you to create a scenario, composed by one or more areas in which one cannot pass since they have been closed or they have to avoided for some reason: floading, terroristic attacks, restoring works, etc. once created you can give it a name and save it. Saved scenarios can be recalled from the What-IF analysis. (feature under testing)
- What-IF analysis: start what-if analysis, and perform the routing from 2 or more points, then you can save it as "studio", Saved Studio can be recalled. (feature under testing)
Other items can be added such as: Bus Stops, Bus paths, tranway, trains, parking, etc. etc. please contact snap4city@disit.org