
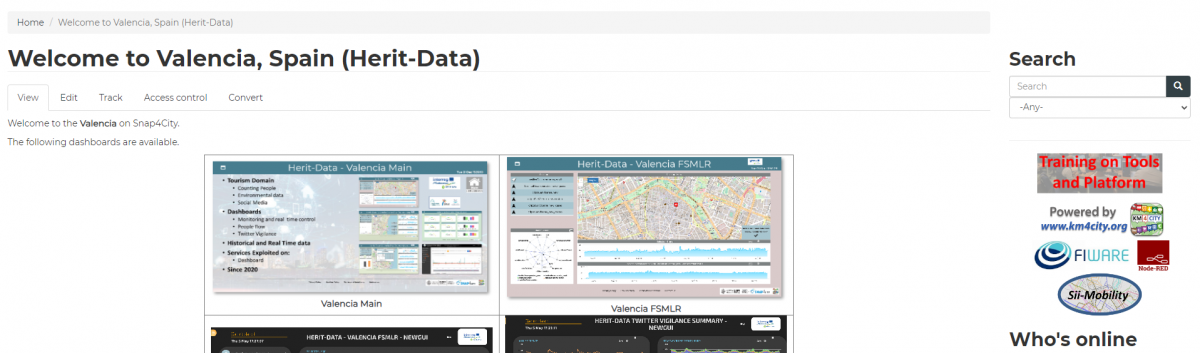
Welcome to the Valencia on Snap4City.
The Port of Valencia, strategically positioned as a gateway to the Mediterranean, is one of the busiest container ports in Europe. Its geographical location at the crossroads of major European trade routes not only facilitates significant commercial traffic but also positions it as a pivotal point for tourist flows, particularly from cruise ships. The port is continuously developing its infrastructure to enhance operational efficiency and visitor experiences, incorporating cutting-edge technologies to manage both commercial and tourist activities sustainably.
Valencia, a vibrant city on Spain's Mediterranean coast, is known for its rich history, diverse architecture, and lively cultural scene. The city's historic centre features notable landmarks such as La Lonja, a UNESCO World Heritage site, and the Valencia Cathedral. Valencia is also famous for its City of Arts and Sciences, a cultural and architectural complex that has become a symbol of the city.
One of the main challenges in Valencia is managing the high tourist numbers that it receives nowadays, which result in significant congestion in its historic centre, known as La Ciutat Vella (Old City). It is crucial to ensure that this high demand for tourism does not negatively impact the preservation of its historical assets, by implementing sustainable tourism practices and improving the management of tourism flows to protect and enhance Valencia’s cultural heritage while providing an excellent experience for visitors.
The following dashboards are available.
 |
 |
 |
 |
 |
 |
The main dashboard TOURISMO Valencia is divided in three main areas:
- A selector on the left that allows to activate/deactivate the visualization of data on the map. The popup on the sensor is responsible for controlling the visualization on the time-trend under the map;
- The map representing the geographic area
- The widget on the bottom part, below the map, with a single content showing the last value of a selected data, and a time trend widget representing the temporal data in a particular time period.
Also a specific widget showing the UV Index and Ozone column forecast data is on the right of the dashboard.
“Documentation” button links to this webpage.
The selector allows to shown/hide the following data represented as pins on the Map or activating specific advanced functionalities:
- Open Weathers: activate/deactivate the pins on the map representing the geographical position of the open weather sensors measuring weather data. By clicking the pin on the map a pop up is shown representing all the data measured by the sensor (i.e. air temperature, air pressure, air humidity, etc.).
- For each of the variable shown in the pop up in the column “Description”, it is possible to click on specific buttons (Last value, last 4 hours, last 24 hours, last 7 days, last 30 days, etc.) to see respectively the last value and the historical data represented in the widgets below the map.
- Sea Conditions: activate/deactivate the pins on the map representing the geographical position of the open weather data representing sea conditions. By clicking the pin on the map a pop up is shown representing all the data measured (i.e. wave direction, wave height, wind wave direction and height, etc.).
- For each of the variable shown in the pop up in the column “Description”, it is possible to click on specific buttons (Last value, last 4 hours, last 24 hours, last 7 days, last 30 days, etc.) to see respectively the last value and the historical data represented in the widgets below the map.
- Air pollution: activate/deactivate the pins on the map representing the geographical position of the open weather sensors measuring air pollution. By clicking the pin on the map a pop up is shown representing all the data measured by the sensor (i.e. CO, PM10, PM2.5, NO, NO2, etc.).
- For each of the variable shown on the pop up in the column “Description”, it is possible to click on specific buttons (Last value, last 4 hours, last 24 hours, last 7 days, last 30 days, etc.) to see respectively the last value and the historical data represented in the widgets below the map.
- UV Index forecasts: showing data regarding UV index of the day and the forecast for the next days;
- Indoor People Counting: showing data related to the number of people in the Musem and in La Lonja;
- Indoor Env. CO2 Noise: showing data coming from internal sensors in the Museum and in La Lonja measuring different parameters: Noise level, CO2, Air Degree Humidity, Air Relative Humidity, Air Temperature, etc.;
- Indoor Env.: showing data coming from internal sensors in the Museum and in La Lonja measuring different parameters: Air Relative Humidity and Air Temperature;
- Indoor CO2: showing data coming from internal sensors in the Museum and in La Lonja measuring different parameters: CO2, Air Degree Humidity, Air Relative Humidity, Air Temperature, etc.
- Cruise Tourists Counting (Cam): displays data collected from the thermal camera located at the port, used for counting cruise tourists.
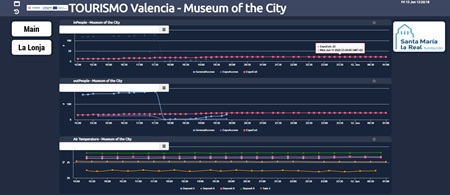
Two buttons are also available in the main dashboard, each of them opening a specific dashboard with trends and metrics from the internal sensors in the Museum of the City and in La Lonja with the analysis of the presence in specific rooms.
The dashboard TOURISMO Valencia Port - People Counting, which contains data from installed devices at the port, is divided in three main areas:
- A selector on the left that allows to activate/deactivate the visualization of data on the map. The popup on the sensor is responsible for controlling the visualization on the time-trend under the map. The number of people are collected by Pax counting sensors and Thermal camera located at the port.
- The map representing the geographic area
- The widget on the bottom, below the map, showing a time trend widget of the selected parameter representing the temporal data in a particular time period. The default value is the wave height.
On the right, the weekly trends of people data collected by Pax counting sensors and thermal camera are displayed and compared.
The dashboard TOURISMO Valencia Port – Cruises, provides a comprehensive view of port occupancy, including information on vessel arrivals and departures, as well as passenger embarkation and disembarkation at the quays. The dashboard also displays data collected by the Cruise Tourists Counting system, a thermal camera installed at the port and specifically designed to monitor and count cruise passengers.
The dashboard TOURISMO Valencia - City Center Visitors - People Monitoring, provides real-time visitor monitoring data collected from devices installed outside key sites, including La Lonja, the Cathedral, and the Torres. By selecting the corresponding icons on the map (in the center of the dashboard), users can view location-specific information such as current occupancy, queue length, daily peak values of the day before and the previous seven days. The selected location automatically updates the “counting table” displayed on the right-hand side. A Get Data button is also available, allowing users to access detailed historical trends and time-series visualizations of the monitored indicators.
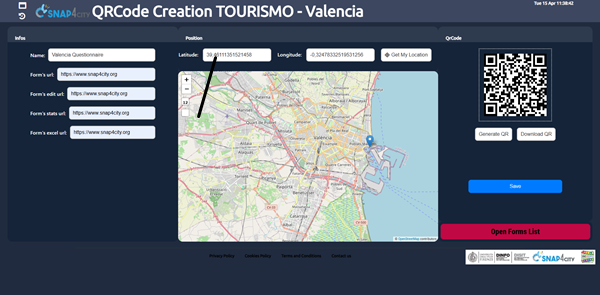
The webpage TOURISMO Valencia – Sentiment Analysis provides a summary, generated by a Large Language Model (LLM), of the results obtained from the analysis of user satisfaction based on a questionnaire. The responses were collected through the Engaging City Users service, accessed via QR Code, as part of the TOURISMO project (https://www.snap4city.org/1081).
The TOURISMO Valencia – Forecasting dashboard provides an automated approach for configuring and visualizing forecasts related to different measures. The left side allows the selection of the available devices for which predictions can be generated, while the right side is dedicated to the configuration of the forecasting parameters.
When a device is selected from the map, the configuration form is automatically updated to reflect the chosen device. The metric to be forecasted can then be selected, together with the forecasting model, either LSTM or Prophet. The Prophet model is recommended for sustainability reasons, as it can adapt to the observed data trend without requiring retraining. The configuration also includes the definition of the start date, which specifies the temporal starting point of the forecast, the prediction rate, expressed in minutes and representing the temporal resolution of each forecast step, and the slot number, which defines the total number of forecast steps to be generated from the selected start date.
After all required parameters have been configured, the computation is initiated by pressing the Submit button. Once the process is completed, the trend chart displayed below the map displays both the historical data of the selected metric and the corresponding forecast produced by the selected model. To use the forecasting tool, users must access the platform using a Snap4City account.
FORMER WELCOME PAGE AVAILABLE HERE
Additional information on
- TOURISMO Webpage on Snap4City
- Project web site: https://tourismo.interreg-euro-med.eu
- https://www.facebook.com/profile.php?id=61557381137979
- https://www.linkedin.com/company/tourismoproject/
Project kind: Interreg Euro-MED, cofounded by the European Union
Error: __clone method called on non-object in og_user_access_entity() (line 2249 of /var/www/html/drupal/sites/default/modules/og/og.module).