
Welcome to the Bisevo on Snap4City.
Biševo Island, located off the coast of Croatia, is renowned for its stunning natural beauty and the famous Blue Cave, a mesmerizing sea cave illuminated by vibrant blue light. Beyond this iconic attraction, Biševo offers visitors the Biševo Geotrail, which spans 19 km and provides an in-depth exploration of the island's diverse geological formations, flora, and fauna. The island's picturesque beaches, such as Porat and Salbunara, and the historical coastal artillery battery at Cape Gatula provide a unique experience for tourists.
While the island attracts numerous visitors, the challenge lies in managing tourist flows to prevent overcrowding at the Blue Cave and to ensure that visitors can make the most of their time on the island by exploring its other attractions.
The following dashboards are available.
 |
 |
 |
 |
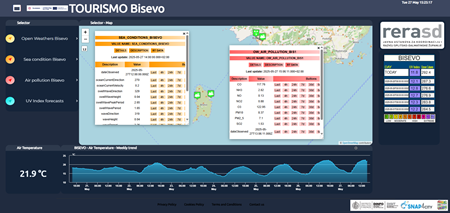
The main dashboard TOURISMO Bisevo is divided in three main areas:
- A selector on the left that allows to activate/deactivate the visualization of data on the map. The popup on the sensor is responsible for controlling the visualization on the time-trend under the map. Redirection button is available for “People Counting” dashboard, which contains data from sniffer devices. “Documentation” button links to this webpage;
- The map representing the geographic area;
- The widget on the bottom part, below the map, with a single content showing the last value of a selected data, and a time trend widget representing the temporal data in a particular time period.
Also a specific widget showing the UV Index and Ozone column forecast data is on the right of the dashboard.
The selector allows to shown/hide the following data represented as pins on the Map or activating specific advanced functionalities:
- Open Weathers: activate/deactivate the pins on the map representing the geographical position of the open weather sensors measuring weather data. By clicking the pin on the map a pop up is shown representing all the data measured by the sensor (i.e. air temperature, air pressure, air humidity, etc.).
- For each of the variable shown in the pop up in the column “Description”, it is possible to click on specific buttons (Last value, last 4 hours, last 24 hours, last 7 days, last 30 days, etc.) to see respectively the last value and the historical data represented in the widgets below the map.
- Sea Conditions: activate/deactivate the pins on the map representing the geographical position of the open weather data representing sea conditions. By clicking the pin on the map a pop up is shown representing all the data measured (i.e. wave direction, wave height, wind wave direction and height, etc.);
- For each of the variable shown in the pop up in the column “Description”, it is possible to click on specific buttons (Last value, last 4 hours, last 24 hours, last 7 days, last 30 days, etc.) to see respectively the last value and the historical data represented in the widgets below the map;
- Air pollution: activate/deactivate the pins on the map representing the geographical position of the open weather sensors measuring air pollution. By clicking the pin on the map a pop up is shown representing all the data measured by the sensor (i.e. CO, PM10, PM2.5, NO, NO2, etc.);
- For each of the variable shown on the pop up in the column “Description”, it is possible to click on specific buttons (Last value, last 4 hours, last 24 hours, last 7 days, last 30 days, etc.) to see respectively the last value and the historical data represented in the widgets below the map;
- UV Index forecasts: showing data regarding UV index of the day and the forecast for the next days.
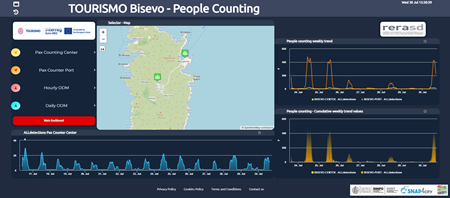
The dashboard TOURISMO Bisevo – People Counting, which contains data from sniffer devices, is divided in three main areas:
- A selector on the left that allows to activate/deactivate the visualization of data on the map. The popup on the sensor is responsible for controlling the visualization on the time-trend under the map. Redirections buttons are also present.
- The map representing the geographic area;
- The widget on the bottom, below the map, with a single content showing the last value of a selected data, and a time trend widget representing the temporal data in a particular time period;
- On the right, the weekly trends of visitor counts and cumulative data collected by sniffers are displayed and compared.
The selector allows to shown/hide the following data represented as pins on the Map or activating specific advanced functionalities in the Pilot Main Dashboard:
- Pax Counting Center: people flow monitoring via sniffer at the Visitor Centre in Bisevo. The pin and the visualization shows the sensor data information such as the last number of sniffed visitors both Wifi, BLE or both. The popup on the sensor is responsible for controlling the visualization on the time-trend under the map;
- Pax Counting Port: people flow monitoring via sniffer at the Mezoporat (port) in Bisevo. The pin and the visualization shows the sensor data information such as the last number of sniffed visitors both Wifi, BLE or both. The popup on the sensor is responsible for controlling the visualization on the time-trend under the map. This data are used for the generation of Origin Destination Matrices;
- Hourly OD: Origin-Destination Matrices generated every hour;
- Daily OD: Origin-Destination Matrices generated every day.
Hourly OD and Daily OD open a tab on the top right corner of the map with some setting and control to:
- Switch the time period between week to months and viceversa;
- Switch the data between inflow and outflow;
- Modify the opacity of the ODM;
- Move back and forward changing the date of the data to be shown.
In the ODM, the blue area represents the area of interest that has been selected. The coloured areas represent the inflow/outflow data to/from the selected area in percentage. The color of the areas are represented according to the colormap shown on bottom left in the map.
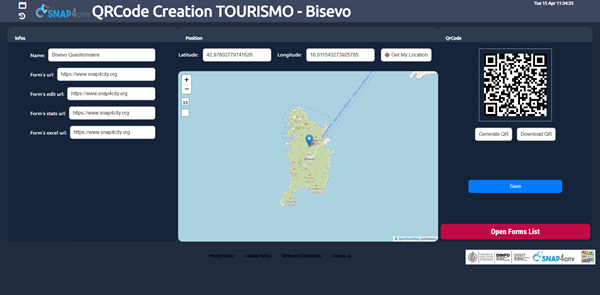
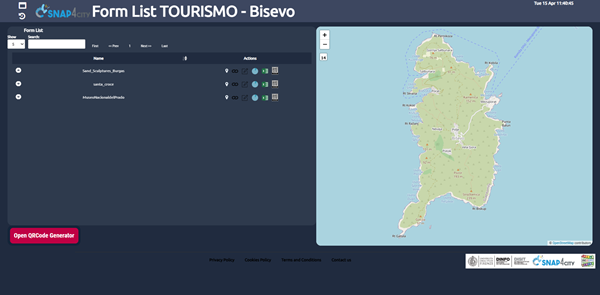
The webpage TOURISMO Bisevo – Sentiment Analysis provides a summary, generated by a Large Language Model (LLM), of the results obtained from the analysis of user satisfaction based on a questionnaire. The responses were collected through the Engaging City Users service, accessed via QR Code, as part of the TOURISMO project (https://www.snap4city.org/1081).
The TOURISMO Bisevo – Forecasting dashboard provides an automated approach for configuring and visualizing forecasts related to different measures. The left side allows the selection of the available devices for which predictions can be generated, while the right side is dedicated to the configuration of the forecasting parameters.
When a device is selected from the map, the configuration form is automatically updated to reflect the chosen device. The metric to be forecasted can then be selected, together with the forecasting model, either LSTM or Prophet. The Prophet model is recommended for sustainability reasons, as it can adapt to the observed data trend without requiring retraining. The configuration also includes the definition of the start date, which specifies the temporal starting point of the forecast, the prediction rate, expressed in minutes and representing the temporal resolution of each forecast step, and the slot number, which defines the total number of forecast steps to be generated from the selected start date.
After all required parameters have been configured, the computation is initiated by pressing the Submit button. Once the process is completed, the trend chart displayed below the map displays both the historical data of the selected metric and the corresponding forecast produced by the selected model. To use the forecasting tool, users must access the platform using a Snap4City account.
- TOURISMO Webpage on Snap4City
- Project web site: https://tourismo.interreg-euro-med.eu
- https://www.facebook.com/profile.php?id=61557381137979
- https://www.linkedin.com/company/tourismoproject/
Project kind: Interreg Euro-MED, cofounded by the European Union
Error: __clone method called on non-object in og_user_access_entity() (line 2249 of /var/www/html/drupal/sites/default/modules/og/og.module).