
Welcome to the Rhodes on Snap4City.
The Medieval Town of Rhodes, included in the List of World Heritage Towns by UNESCO, is the most significant attraction in Rhodes, drawing visitors globally. Characterized by its labyrinthine streets, the town features a rich tapestry of historical architecture, including small houses, grand knightley buildings from the 15th and 16th centuries, and numerous medieval churches interspersed with several mosques, adding an oriental flair to its skyline. Notable landmarks include the Palace of the Grand Master of the Order, known as the "Castello," which now houses the Museum of Rhodes with its extensive exhibits.
The following dashboards are available.
|
|
 |
 |
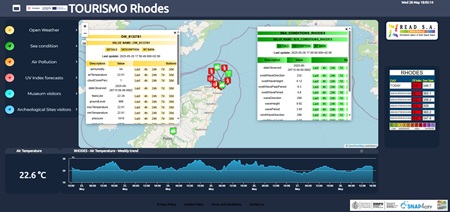
The main dashboard TOURISMO Rhodes is divided in three main areas:
- A selector on the left that allows to activate/deactivate the visualization of data on the map. The popup on the sensor is responsible for controlling the visualization on the time-trend under the map;
- The map representing the geographic area;
- The widget on the bottom part, below the map, with a single content showing the last value of a selected data, and a time trend widget representing the temporal data in a particular time period.
Also a specific widget showing the UV Index and Ozone column forecast data is on the right of the dashboard.
“Documentation” button links to this webpage.
The selector allows to shown/hide the following data represented as pins on the Map or activating specific advanced functionalities:
- Open Weathers: activate/deactivate the pins on the map representing the geographical position of the open weather sensors measuring weather data. By clicking the pin on the map a pop up is shown representing all the data measured by the sensor (i.e. air temperature, air pressure, air humidity, etc.).
- For each of the variable shown in the pop up in the column “Description”, it is possible to click on specific buttons (Last value, last 4 hours, last 24 hours, last 7 days, last 30 days, etc.) to see respectively the last value and the historical data represented in the widgets below the map.
- Sea Conditions: activate/deactivate the pins on the map representing the geographical position of the open weather data representing sea conditions. By clicking the pin on the map a pop up is shown representing all the data measured (i.e. wave direction, wave height, wind wave direction and height, etc.).
- For each of the variable shown in the pop up in the column “Description”, it is possible to click on specific buttons (Last value, last 4 hours, last 24 hours, last 7 days, last 30 days, etc.) to see respectively the last value and the historical data represented in the widgets below the map.
- Air pollution: activate/deactivate the pins on the map representing the geographical position of the open weather sensors measuring air pollution. By clicking the pin on the map a pop up is shown representing all the data measured by the sensor (i.e. CO, PM10, PM2.5, NO, NO2, etc.).
- For each of the variable shown on the pop up in the column “Description”, it is possible to click on specific buttons (Last value, last 4 hours, last 24 hours, last 7 days, last 30 days, etc.) to see respectively the last value and the historical data represented in the widgets below the map.
- UV Index forecasts: showing data regarding UV index of the day and the forecast for the next days;
- Museum Visitors: historical monthly data on the number of visitors to the main museums of Rhodes;
- Archeological Sites Visitors: historical monthly data on the number of visitors to the main Archeological Sites of Rhodes.
The dashboard TOURISMO Rhodes – People Counting, which contains data from installed radar sensors, is divided in three main areas:
- A selector on the left that allows to activate/deactivate the visualization of data on the map. The popup on the sensor is responsible for controlling the visualization on the time-trend under the map. The number of inflow/outflow related to people, bikes, and Escooters are collected by 8 radar sensors located in the Gates of the Medieval City of Rhodes. The Mobility Analysis is also provided by dedicate bar series where type that compare the different transport modes, including pedestrian, across the entrance of various gates.
- The map representing the geographic area
- The widget on the bottom, below the map, showing a time trend widget of the selected parameter representing the temporal data in a particular time period. The current capacity of the Medieval City is also provided by analysing the difference between the count of inflow and outflow in real-time.
- On the right, both the daily trends of people, bicycle and Escooters data, collected by radar sensors at each gate are, displayed and compared. Redirections buttons are also present.
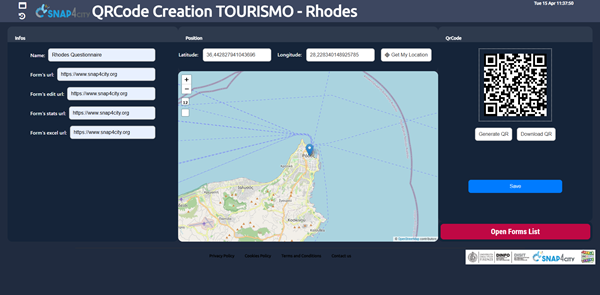
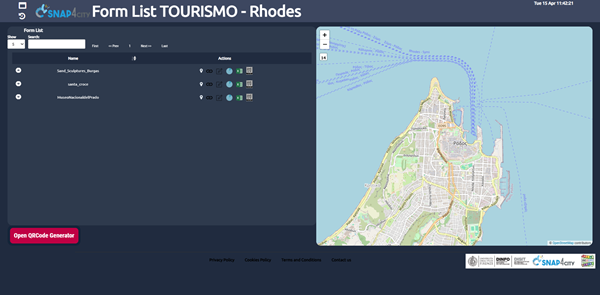
The webpage TOURISMO Rhodes – Sentiment Analysis provides a summary, generated by a Large Language Model (LLM), of the results obtained from the analysis of user satisfaction based on a questionnaire. The responses were collected through the Engaging City Users service, accessed via QR Code, as part of the TOURISMO project (https://www.snap4city.org/1081).
The TOURISMO Rhodes – Forecasting dashboard provides an automated approach for configuring and visualizing forecasts related to different measures. The left side allows the selection of the available devices for which predictions can be generated, while the right side is dedicated to the configuration of the forecasting parameters.
When a device is selected from the map, the configuration form is automatically updated to reflect the chosen device. The metric to be forecasted can then be selected, together with the forecasting model, either LSTM or Prophet. The Prophet model is recommended for sustainability reasons, as it can adapt to the observed data trend without requiring retraining. The configuration also includes the definition of the start date, which specifies the temporal starting point of the forecast, the prediction rate, expressed in minutes and representing the temporal resolution of each forecast step, and the slot number, which defines the total number of forecast steps to be generated from the selected start date.
After all required parameters have been configured, the computation is initiated by pressing the Submit button. Once the process is completed, the trend chart displayed below the map displays both the historical data of the selected metric and the corresponding forecast produced by the selected model. To use the forecasting tool, users must access the platform using a Snap4City account.
- TOURISMO Webpage on Snap4City
- Project web site: https://tourismo.interreg-euro-med.eu
- https://www.facebook.com/profile.php?id=61557381137979
- https://www.linkedin.com/company/tourismoproject/
Project kind: Interreg Euro-MED, cofounded by the European Union