1. Introduction
The following manual has the purpose of describing a feature of the Dashboard Builder which allows some widgets to send and/or receive actions, events and data through JavaScript code with parameters from/to other widgets, in order to make them interact/smart with each other.For example, you may be able to click on a section of a pie chart to extract a piece of data and view it in more detail on a table on another widget; make spatial drill-down/up on maps, temporal drill down/up on time series data etc.
Please refer to the Server-Side Business Logic section on the following document https://www.snap4city.org/download/video/Snap4Tech-Development-Life-Cycle.pdf
Server-Side Business Logic implies to send commands to the Proc.Logic / IoT App implemented as Node-RED Node.JS processes running on server-side cloud via a visual editor.
Please remind that only AreaManager can access at features of the Client-Side Business Logic on Snap4city.org platform, and they have to perform a request to the platform administrator by sending an email to snap4city@disit.org : If you need to become an AreaManager, please also ask to the administrator by sending an email to snap4city@disit.org .
This feature is also available on MicroX installations, in those cases the access to the CSBL functionality is provided by registering the user on the database table providing the access.
1.1 Snap4City development environment
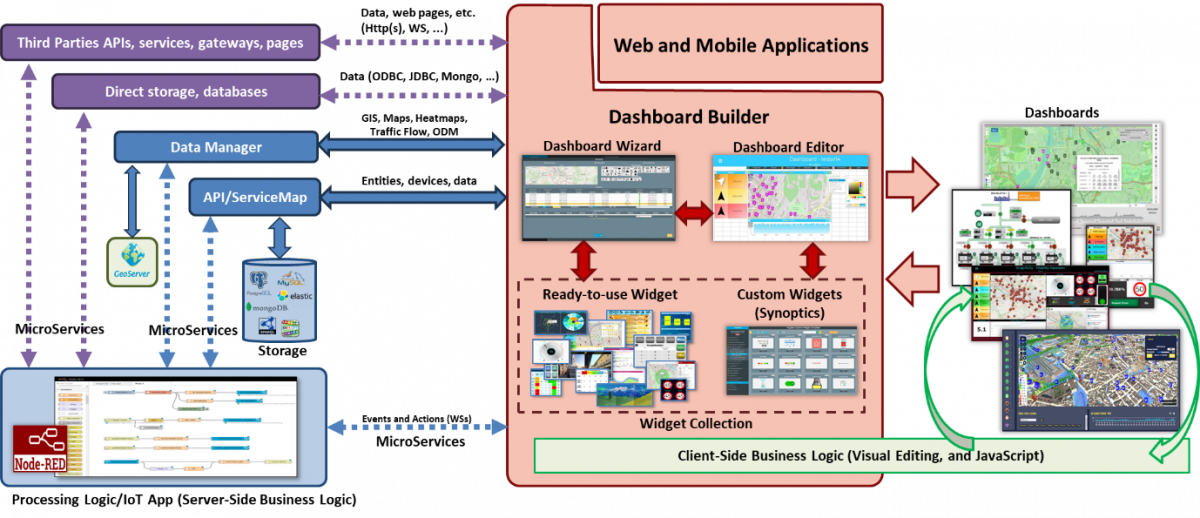
In Snap4City, Client-Side Business Logic is a solution to close the loop from user actions and effects on widgets directly on the client side, on the browser. This approach allows a separated context for each user since any Business Logic computation is performed on client side at every connection, thus reducing the computational workload on server side. Actually, Client-Side Business Logic, CSBL, and Server-Side Business Logic, SSBL, may be present at the same time behind a Dashboard and thus behind a Business Intelligence / Smart Application. This approach may be used to save some context and share it with other users. In CSBL the logic code is formalized in JavaScript only, while in SSBL the logic is formalized in Processing Logic which is Node-RED plus some JavaScript, also called IoT Apps. Both SSBL and CSBL can access/query platform data and external data from any kind of APIs, including third party APIs.
The design and development of the smart applications with Graphic User Interface, GUI, means to develop views which put in connection the back-office data with some dynamic visual representation and provides to the users’ interactive elements to change the observed views or go for another dashboard as well.
In Snap4City, the views are implemented as smart Dashboards which are composed by graphical widgets connecting storage on the basis of the Entity Instances, Processing Logic (IoT App) data/nodes in stream, Synoptics, External Services, and Brokers. Widgets can be maps, time trends, chords, spidernet, bar series, tables, buttons, animated elements, sliders, etc., from libraries such as D3 and Highcharts or custom Synoptics widgets by using an SVG-based integrated tool and templates. Moreover, the Dashboard may dress different styles / themes in their rendering and the designer / developer can select them soon or later in the creation process.
The power of the user interface is grounded on the possibility of easily connecting the graphic widgets with the Entity Instances in a smart interactive manner, keeping humans in the loop. For example: selecting an area by clicking on a Pin/service on map and connecting related data to widgets such as a pie chart and time series, as well as producing some computation, for instance calculating the average values or other metrics. To this end, the User Interface needs to provide some business logic which can be on server-side (formalized in Processing Logic/IoT App, Node-RED) to serve all the users at the same time, and client-side for evolving user interface behavior on each client device autonomously. Client devices are typically a browser but could also be a mobile app. Please note that user actions can also produce effects on Brokers, can activate AI/XAI processes, etc., these activations cane performed via SSBL or directly acting on API provided by Python / Rstudio processes.
According to SMADELC, SMart Applications’ DEvelopment Life Cycle, the design of views starts with the production of Dashboards’ mockups (see the development life cycle document). For each Dashboard, a set of information is requested such as: aim, status, Subnature classification target device, GUI style, list of widgets and their description, and the business logic kind.
The Dashboards are called passive when the data represented come only from platform storage without any event driven connection from platform to dashboard and vice versa via SSBL for presenting/producing data in real time. Active views/dashboards are those that provide those connections which can be SSBL or CSBL. They are initially developed as passive Dashboards in first version and get smarter and smarter in successive sprints of the development life cycle. Moreover, for fast prototyping the SSBL is developed by using IoT App Node-RED, which provides a set of nodes corresponding to graphical widgets on dashboards (via secure WebSocket), thus overcoming the limitation of Node-RED native dashboards. This approach is very effective and viable for fast prototyping and to realize strictly synchronized smart applications in which all the actions on the web interface are shared with all the users (typically limited) as happens in the IoT world. For example, the monitoring panel of an industrial plant should present the same data to all the users connected to it.
On the other hand, when the users expect to play with the data rendered on dashboards for implementing some business intelligence tool, their experience and the evolving data represented in the interface according to their activities is going to change. Those aspects are personal, and context based as one expects to have on a smart application, leading to an evolving user interface that should have a CSBL. In Snap4City, the development of CSBL can be implemented by adding JavaScript functions embedded into the graphic widgets as call back actions, which can perform actions on other widgets and on the platform, and also on third party services, such as a REST Call to API.
To develop this phase one has to follow the Dashboard descriptions performed in the design phase. And at the same time, he/she has to answer questions such as:
- The user interface has to provide some dynamic changes on the basis of the user actions? Which kind of changes? (CSBL would be need in the affirmative case)
- How many users are using it? (CSBL would be need in the multiple users performing their own private analysis)
- Is it a view for the control room and decision makers of a business intelligence tool for playing with data and solutions? (SSBL would be need if the idea is to create a dashboard in which all the users are going to see the evolution of data even if they are requested by only one of them: sharing the experience or the view)
- Etc.
How to proceed: The developers on Snap4City can visually create dashboards with a drag and drop tool by using Dashboard Builder which is assisted by a number of tools:
- Wizard to match data with widgets. It is an expert system for immediate matching HLT (High Level Types: IoT Devices, heatmaps, traffic flows, POI, ODM, etc.) data vs graphics representation for creating Dashboards by rendering and acting on data with a large range of graphics widgets, which may have intelligence in the back by means of:
- SSBL: Processing Logic (IoT App) on data flow combining powerful Microservices/nodes, Data Analytics and API, to implement SSBL.
- CSBL: implemented as visual programming and JavaScript on specific Dashboard Widgets as described in the following of the life cycle document mentioned above.
- Custom Widget production tool for creating new widgets and Synoptics by using visual tools and templates: for real time rendering data on graphical scenographic tools, and for graphic interaction on the systems from dashboard to actuators through end-to-end secure connection.
- Style Theme modeling for deciding which style to use on the front-end dashboards. It is easy to change the graphical theme and style of the dashboard to have your precise fitting on your applications and portals.
- External Services for integrating external tools via SSBL / Proc.Logic and/or via IFRAME into an External Content Widget, or directly calling them as rest API or other means from CSBL.
The list of graphical widgets available in Snap4City to compose the user interface is accessible at the following link: https://www.snap4city.org/download/video/course/das/
In Snap4City, there is a specific tutorial for the Dashboard development with several examples: https://www.snap4city.org/download/video/course/das/
Thus, in CSBL we have IN, OUT and IN/OUT widgets (quite similar to SSBL):
- IN Widgets are those that are prepared to receive some actions/commands (inputs) from the Users or from other widgets as events/messages/commands. For example, a click on a button, a click on the map, etc. They are in some way passive, in the sense that they do not produce any action on other widgets. They do not have Custom CSBL JavaScript inside.
- OUT Widgets are those that are prepared to produce send some messages / triggers to other widgets. For example, a view of a bar series on some other data, a rendering of a time series, a rendering of a set of Entities on the map, etc. They can be active in the sense that they are capable to produce actions on other widgets, via the Custom CSBL JavaScript they have inside.
- IN/OUT Widgets are those that provide capabilities of both IN and OUT Widgets. For example, a map can receive an IN commands to show a PIN, and can send an OUT command to show the data of a selected set of PINs on some barseries.
In the development of the CSBL, two modalities are possible: (i) mixt of visual programming and JavaScript, (ii) fully JavaScript (also called former full CSBL). The JavaScript may be activated by events / actions performed by the User on the GUI of the Widget, and may also send messages/events on other widgets as well perform some API call to Snap4City services or to external services of any kind. While the OUT Widgets are ready to receive commands/messages from CSBL JavaScript (other widgets), similarly to what they do when receiving commands from SSBL via Web Socket to perform actions on the widget or any other JavaScript action/activity.
The Developers that would like to develop CSBL have to be singularly authorized, please ask to snap4city@disit.org, and in MicroX local installation ask to us for the location on your local database for the activation of the functionality to your users. They will be entitled to go in the widget More Options tab and to find and edit a the CK editor to insert the JavaScript code according to this manual, and examples.
When working in SSBL, widgets can be created and edited from Node-Red Processing Logic. When working in a CSBL context, widgets can be created through the Dashboard Wizard, as shown in the figure here below.

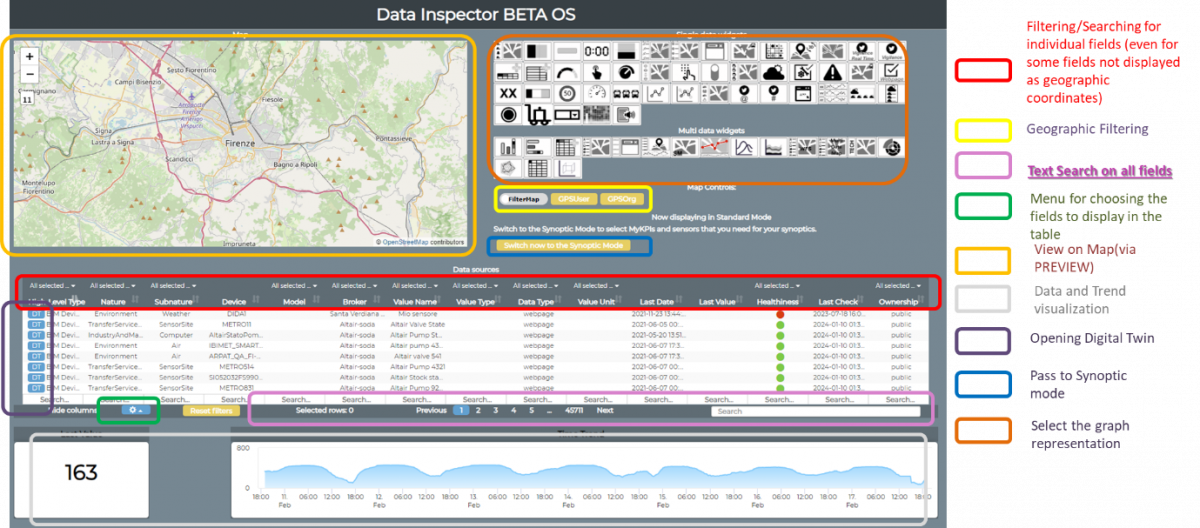
Figure: Dashboard Wizard of Snap4City, former and newer. The Dashboard wizard is also accessible in a shape of Data Inspector, to search and navigate on data of any kind.
The desired widget type can be chosen from the up-right section of the Wizard showing the available widgets. The desired data source can be chosen from the “Data Sources” table, exploiting the filters on column headers, as well as the text search box in the bottom-right corner of the same table. When the desired choices have been performed, by clicking on the “Next” button a final “Check and Summary” tab is shown for final check. At last, clicking on the “Create widget” magic wand the desired widget(s) are created in the current user dashboard. In this way, the created widget(s) are in the form of IN widgets, and they are ready to receive and show data and actions by JavaScript, as described in the table “Commands which are ready to execute from JavaScript” in the next pages.
In order to create OUT widgets (those widgets which have this capability are listed in the following table “Users’ Action Description and effects”), an authorized developer can add the desired JavaScript code in the CK Editor box in the widget “More Options” box, as shown in the next Figure. The JavaScript code should be provided as a single JavaScript function named “execute”. Please refer to the specific user manual for more detailed instructions.
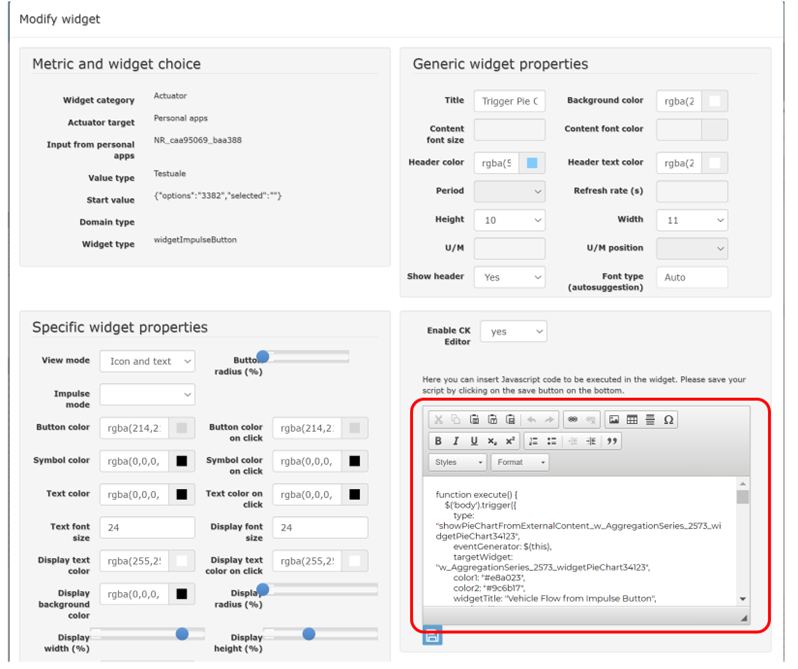
Figure 2: More Options of Widget with activated CK Editor for CSBL.
OUT and IN/OUT Widgets which present the possibility of scripting in JavaScript when an action is performed on their graphic user interface are reported in the following table. The performed action by the user provokes the activation of a call back that can be filled in the JavaScript editor of the Widget to formalize the action to be performed. At the moment in which an action is triggered, a number of parameters can be provided. For example, geographic coordinates can be passed at a click on map, etc. Into the JavaScript, the developer can code how this information can be used to command IN Widgets, and also REST Calls to Smart City API and other activities.
In general, a widget may receive commands/events (IN) (from other widget and from the user) and may send commands/events. Moreover, the received commands and events my provoke changes on its own representation as well as to other widgets by sending events, triggers commands. The following figure represent a schema.
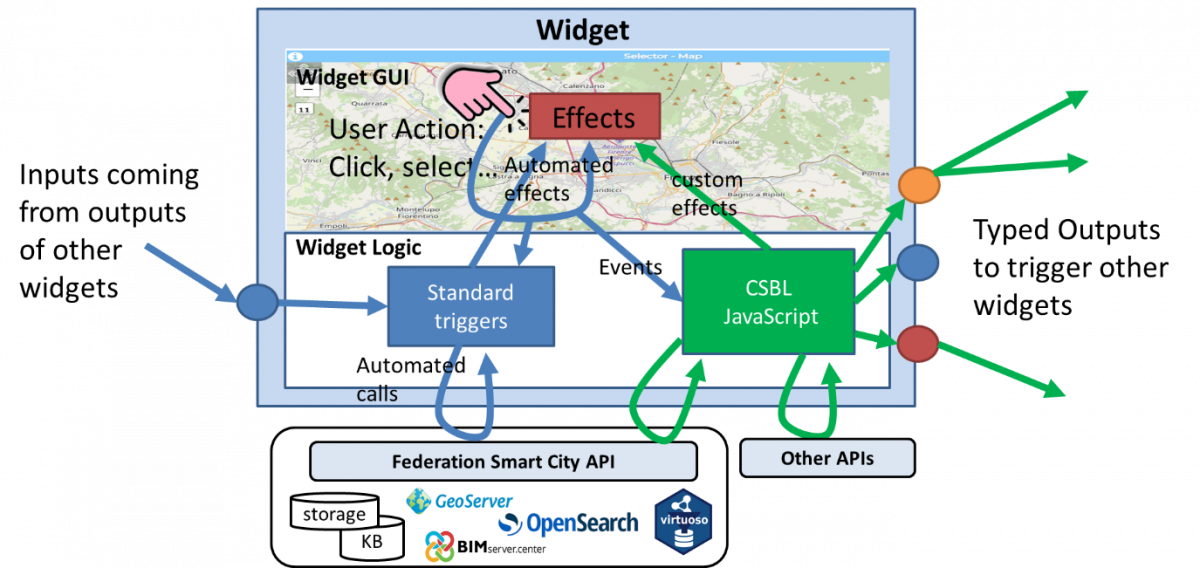
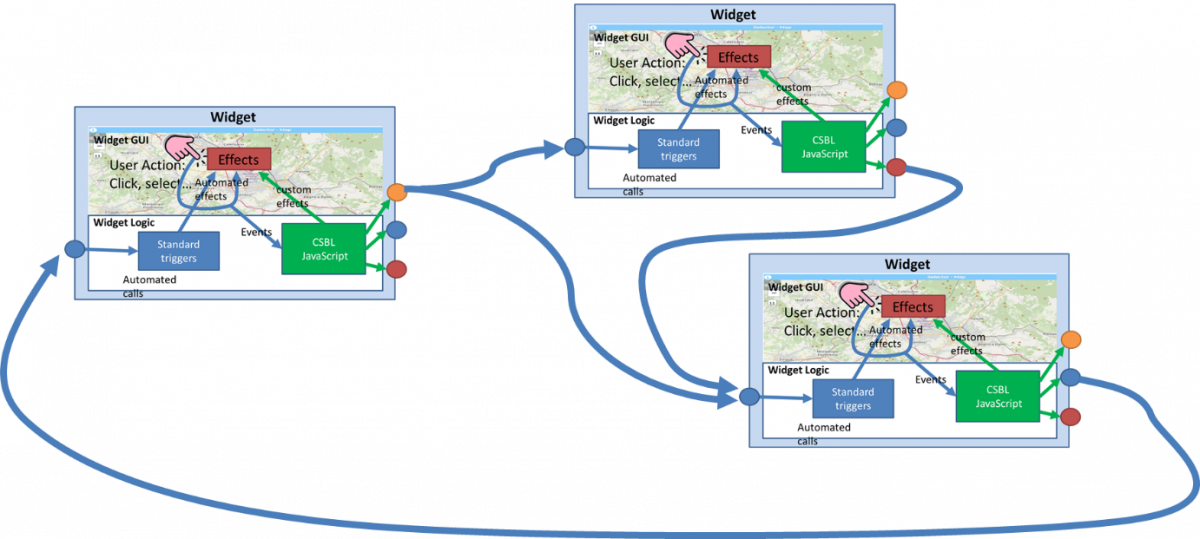
Figure: The CSBL concepts on Widgets: single and composition.
The inputs received by a widget (coming from others) provoke standard triggers and thus automated effects on the GUI counterpart of the widget. This means that standard triggers cannot be used to execute CSBL JavaScript and custom effects in the same widget in which they are received, but the Effect on GUI are constrained to be compliant with the standard automated effects. In summary: IN widgets provide only blue and red parts of the above figure; pure OUT widgets provide red and green; IN/OUT provide all parts.
This approach avoids the possibility to perform indefinite loops among widgets. On the other hand, it is not a limitation on logic since each widget can control any number of other widgets with its outputs. This mechanism allows the developers to create business intelligence tools in which the action on some GUI Widget (e.g., click, drill down, zoom on map, etc.) can produce a result directly shown on other widgets.
Outputs are usually typed, in the sense that the JSON in out should be compliant with some standard message format, plus other custom messages can be defined as well.
The OUT widgets provide space for Custom JavaScript editable via CKEditor with the following structure, in which is evident that the widget is going to execute function execute(), in which the Events may be processed with specific JavaScript segments. The CSBL JavaScript is activated by Events coming from the Users’ Actions. The CSBL JavaScript segment may include:
- calls to ASCAPI (Advanced Smart City API of Snap4City), usage of AJAX, authentications, etc.
- call to external API, usage of AJAX, authentications, etc.
- production of Typed Outputs to trigger other widgets (one or more) of the dashboard provided that the widget IDentifier is known.
- commands to open other dashboards/views passing also parameters to them.
|
In the Snap4City tools there are two modalities of producing Business Intelligence dashboards. In particular they are called:
|
n the CKeditor of each Widget via More Options, you can create or you can find a different template as reported in the following table. The left version allows you to be compliant with the Full Custom CSBL in JavaScript, while the right version allows you to be compliant with CSBL Visual Editor as described in the following. There is a certain level of compatibility among the two approaches. The Cull Custom CSBL allows to exploit in deep all the functionalities of the Dashboard Builder for smart applications
|
/* |
/* |
|
function execute () |
function execute(){ |
As a results, a business intelligence application and any smart applications can be built controlling the widgets and defining the CSBL with the simple insertion of CSBL JavaScript.
Please note that not all widgets provide IN/OUT capabilities. Some of them are limited to IN other to OUT and most of them are IN/OUT. The following two Tables provide you a short summary. If you need to have more IN/OUT CSBL functionalities on widgets, please send an email to snap4city@disit.org.
1.2 - Table of Input Commands to OUT and IN/OUT Widgets
Please note that OUT Widgets may receive commands from the User Actions on widget GUI, and they can be automatically capable to make queries to the Smart City API (ASCAPI/SCAPI) (automated calls in the figure above). They are typically configured to work on the basis of query (for example a selector) or a SURI (Service URI, as defined in the development manual and on training course of Snap4City) from which they perform the query to the ASCAPI from which they receive the Entities data to be shown in the widget itself. This means that the Widgets are filled/initialized with some data on which the user may perform some Action producing and internal Event which can provoke effect outside via CSBL on to trigger other connected widgets as well.
Those marked in Green are also validated in the CSBL Visual Editor. The column “Full Custom CSBL” refers to the full custom CSBL JavaScript coding approach described in this document, while the CSBL Visual editor compatibility is reported I the last column. The CSBL Visual Editor approach is also described in this document.
|
OUT and IN/OUT Widgets |
Users’ Action Description and effects |
Full Custom CSBL |
CSBL Visual editor |
|
widgetTimeTrend |
Drill-Down on time interval selection (zoom), providing, SURI, value name, start and end time stamp |
Time, SURI, ValueName, starttime, endtime |
|
|
Send Reset Drill-Down |
DateTime |
DateTime | |
|
Click on a single time instant, providing time stamp, SURI and value name |
DateTime |
DateTime | |
|
widgetMap |
Click on a generic point on the map, providing coordinates |
Space Selection |
|
|
Click on a PIN, providing coordinates and ServiceURI of the clicked PIN |
SURI Selection |
SURI | |
|
Select the bounding box area shown on the map, and the zoom level in order to perform geographical Drill-Down on the entities click on dedicated button on map (devices identified by SURIs, Points of Interest etc.) which are currently shown on map |
Space Selection |
ListSURI | |
|
widgetPieChart |
Click on a sector that identifies the name of a metric, providing: value, timestamp, entity name (from which the SURI can be reconstructed) value name, value type and value unit |
SURI Selection |
SURI |
|
click on a sector that identifies a device ID or MyKPI ID, providing: value, timestamp, entity name (from which the SURI can be reconstructed) value name, value type and value unit |
SURI Selection |
SURI | |
|
Get date and time from the calendar |
DateTime |
DateTime | |
|
Click on legend, providing the status (e.g.: “checked” or “unchecked”) of the metric/SURI which has been clicked (under development) |
SURI Selection |
SURI | |
|
widgetBarSeries |
Click on a bar, providing: value, timestamp, entity name (from which the SURI can be reconstructed) value name, value type and value unit |
SURI Selection |
SURI |
|
Get date and time from the calendar |
DateTime |
DateTime | |
|
Click on legend, providing the visibility status of each metric/SURI |
SURI Selection |
SURI | |
|
widgetRadarSeries |
Click on a radar axis related to a specific metric of a specific device, providing: value, timestamp, entity name (from which the SURI can be reconstructed) value name, value type and value unit |
SURI Selection |
SURI |
|
Get date and time from the calendar |
DateTime |
DateTime | |
|
Click on legend, providing the visibility status of each metric/SURI |
SURI Selection |
SURI | |
|
widgetCurvedLineSeries (multi series) |
Drill-Down on time interval selection (zoom), providing: start and end time stamp, and list of SURI. It is also possible to program the synchronization of multiple widgetCurvedLineSeries widgets. |
Time, SURI, ValueName, starttime, endtime |
DateTime, SURI |
|
Click on a single time instant, providing: time stamp and list of objects including SURIs and related entity names and value names |
Time Selection, list of SURI, value names |
||
|
Click on legend, providing the visibility status of each metric/SURI |
SURI Selection |
SURI | |
|
Get date and time from the calendar |
DateTime | DateTime | |
|
Send Reset Drill-Down |
Reset zoom |
||
|
widgetDeviceTable |
Click on the action buttons, providing the action type, the corresponding SURI and a list of attributes with their corresponding values |
SURI Action |
|
|
widgetImpulseButton |
Click on button as a trigger (no parameters are provided) |
Action |
|
|
widgetOnOffButton |
Click on button, providing the new status |
Action (param) |
|
|
widgetButton |
Click on button, providing some action with parameters, a SURI plus type, for exmaple |
Action (param) |
|
|
widgetKnob |
Drag on knob, providing the value selected on the knob |
Action (param) |
|
|
Click on minus and plus action (under development) |
Action (param) |
||
|
widgetNumericKeyboard |
Click on the confirm button, providing the numeric value typed on the keyboard |
Action (param) |
|
|
widgetEventTable |
Click on the action buttons, providing the action type, the corresponding event SURI and the ordering criteria |
SURI Action |
|
|
widgetExternalContent |
It can support HTML pages and SVG Synoptics, in addition to JavaScript, so that it can perform a wide range of actions that can be defined in the HTML/SVG/JS code by the users. |
Depending on program |
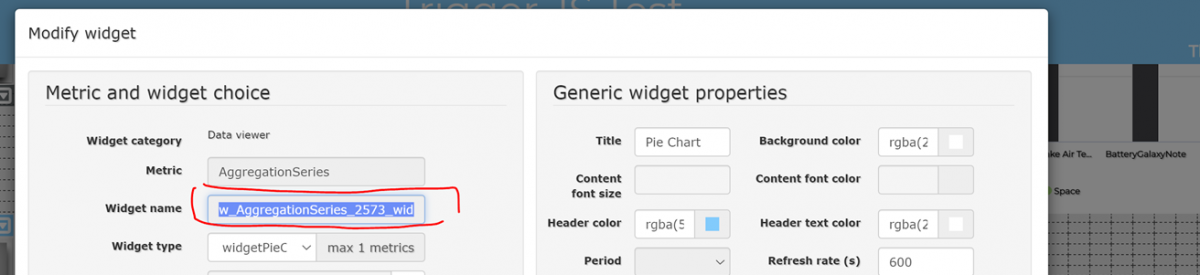
IN and IN/OUT Widgets present the possibility of receiving Input commands from other widgets and are reported in the following table. In Full Custom CSBL, each IN Widget to be controlled/targeted by other widgets have to be identified/referred by their ID/name. The ID/identifier of each targeted Widget is accessible in the More Options of the widget to be targeted, the so-called Widget name/ID (which is automatically generated and not editable). In the CSBL Visual Editor the connections are automatically addressed by the CSBL visual editor, and maintained also when you clone a dashboard.
![]()
Figure: Widget name/ID from the More Options config.
In most cases, the commands to be sent to an IN Widget includes a JSON very similar or identical to the JSON to be sent to the widget from the Node-RED in the context of writing a SSBL. So, please refer to the same help manual and web pages for the same widgets, and to this document.
1.3 - Table of Input Commands to IN and IN/OUT Widgets
Those market in Green are also tested in the current version of CSBL Visual Editor. The column “Full Custom CSBL” refers to the full custom CSBL JavaScript coding approach described in this document, while the CSBL Visual editor compatibility is reported I the last column. The CSBL Visual Editor approach is also described in this document.
|
IN and IN/OUT Widgets |
Commands which are ready to be executed from Widget according to JavaScript in some IN Widget |
Full Custom CSBL |
CSBL Visual editor |
|
widgetPieChart |
Receive a JSON containing a list of SURI, metric names and/or values, and show their corresponding values on a Pie Chart graph. |
List of SURI, or data |
SURI |
|
set date and time from the calendar |
DateTime |
DateTime | |
|
widgetRadarSeries |
Receive a JSON containing a list of SURI, metric names and/or values, and show their corresponding values on a Radar/Kiviat graph. |
List of SURI, or data |
SURI |
|
set date and time from the calendar |
DateTime |
DateTime | |
|
widgetBarSeries |
Receive a JSON object containing a list of SURI, metric names and/or values, and show their corresponding values on a Bar graph. |
List of SURI, or data |
ListSURI |
|
set date and time from the calendar |
DateTime |
DateTime | |
|
widgetSingleContent |
Receive a SURI and a metric name, or a value, or a text string, and show the corresponding value. |
SURI or data, etc. |
SURI |
|
Receive and show a HTML/JS page |
HTML |
||
|
widgetSpeedometer |
Receive a SURI and a metric name, or a value, and show the corresponding value on a speedometer graph. |
SURI, or data |
SURI |
|
widgetGaugeChart |
Receive a SURI and a metric name, or a value, and show the corresponding value on a gauge graph. |
SURI, or data |
SURI |
|
widgetTimeTrend |
Receive a SURI and a metric name, or a value, and show the corresponding time-series on a line, spline, area or stacked area graph. |
SURI, or data |
SURI |
|
Receive reset zoom |
Reset |
||
|
widgetTable |
Receive a JSON containing a list SURI, metric names and/or values, and show the corresponding time-series on a HTML static table. |
List of SURI, or data |
ListSURI |
|
Receive start datetime, end datetime without change sources IDs (under development) |
|
||
|
widgetCurvedLineSeries |
Receive a JSON containing a list of SURI, metric names and/or values, and show the corresponding time-series on a line, spline, area or stacked area graph. |
List of SURI, or data |
ListSURI |
|
Receive start datetime, end datetime without change sources IDs |
time interval |
DateTime Interval | |
|
set date and time from the calendar |
Time |
DateTime | |
|
Receive reset zoom |
Reset |
||
|
widgetDeviceTable |
Receive a JSON containing a list of SURI representing IoT devices, and show their related attributes and values on an interactive table which provides action buttons. |
List of SURI, or data |
ListSURI |
|
widgetEvent |
Receive a JSON containing a list of SURI representing events as virtual devices, and show their related attributes (e.g., start and end date) and values on an interactive table which provides action buttons. |
List of SURI, or data |
ListSURI |
|
widgetMap |
Receive a JSON containing a list of SURI or entities (such as heatmaps, categories of Points of Interest etc.) and show them on an interactive map as clickable markers, dynamic SVG pins, traffic flows, heatmaps etc. |
List of SURI, or data |
ListSURI |
|
widgetOnOffButton |
Receive and show a value representing the status |
Action |
Action |
|
widgetKnob |
Receive and show a value |
Action |
Action |
|
widgetNumericKeyboard |
Receive and show a value |
Action |
Action |
|
WidgetExternalContent |
A SURI and a type, eventual parameters |
Action |
Action |
Other functions which can be exploited on Actions JavaScript segments:
- Open a New Dashboard: openNewDashboard()
- Get parameters: getParams()
In this manner, it is possible to activate in a new dashboard some actions on specific elements.
In each dashboard where at least one of its widgets provides a JavaScript code saved in the CK Editor, the history of all the different actions performed and triggered in the CSBL is locally saved in the browser, until the dashboard is closed. This is done in order to allow the user to come back to different views performed by earlier actions. The history of CSBL actions can be viewed by clicking on the history clock icon which appears in these cases on the top-right corner of the dashboard header.