This dashboard has been created to provide an instrument to City Officers and Experts about environmental and weather aspects of the city. The users can pass from the overview to see specific data and piking values in specific points of the map as he/she prefers. See aslo the special views on Jätkäsaari at higher resolution/density. The dashboad has been produced by Snap4City team, you can find more and more information on Https//www.snap4city.org
Dashboard: https://www.snap4city.org/dashboardSmartCity/view/index.php?iddasboard=MTQwNg==
Please read https://www.snap4city.org/drupal/node/435 for the definitions of the measured and computed values.
On the left you can select to see on map:
- BusStop: PINs about bus stops in the area. When you select a PIN the information about the bus stop (line numbers and details) can be visualized.
- Ticket Sale: PINs about ticket sale locations in the area. When you select a PIN the information about the the tiket sale (Locality and Address) can be visualized.
- Traffic Sensor: PINs about the location of traffic sensors, from ehm you can see the values measured on traffic sensors. Please note that they are located on the highways just on the border of the city and in the country side (see below for what you can do on the pin for showing data, and drill down on the several data associated with sensors).
- Weather Sensors: PINs about the location of weather sensors (see below for what you can do on the pin for showing data, and drill down on the several data associated with sensors).
- Air Temp heatmap: real time heatmap of the air temperature in the Helsinki area. The heatmap is upded every 2 hours. On the Heatmap Controls widget: the animated values of the entire 24 hours are available, as well as with "Prev" button the past heatmaps.
- Humidity Heatmap: real time heatmap of the air humidity in the Helsinki area. The heatmap is upded every 2 hours. On the Heatmap Controls widget: the animated values of the entire 24 hours are available, as well as with "Prev" button the past heatmaps.
- Air Quality Sensors: PINs about the location of air quality sensors (see below for what you can do on the pin for showing data, and drill down on the several data associated with sensors).
- Noise sensors: PINs about the location of noise sensors, the values are measured in db (decibles) (see below for what you can do on the pin for showing data, and drill down on the several data associated with sensors).
- Noise Heatmap: real time heatmap of noise levels in the Helsinki area. The heatmap is upded every 2 hours. On the Heatmap Controls widget: the animated values of the entire 24 hours are available, as well as with "Prev" button the past heatmaps.
- PM10 heatmap: real time heatmap of pollutant levels in air in terms of PM10 (measured in µg/m3) particles in the Helsinki area. The heatmap is updedd every 2 hours. On the Heatmap Controls widget: the animated values of the entire 24 hours are available, as well as with "Prev" button the past heatmaps.
- PM2.5 heatmap: real time heatmap of pollutant levels in air in terms of PM2.5 (measured in µg/m3) particles in the Helsinki area. The heatmap is upded every 2 hours. On the Heatmap Controls widget: the animated values of the entire 24 hours are available, as well as with "Prev" button the past heatmaps.
- NO2 heatmap: real time heatmap of pollutant levels in air in terms of nitrogen dioxide (NO2 measured in µg/m3) in the Helsinki area. The heatmap is upded every 2 hours. On the Heatmap Controls widget: the animated values of the entire 24 hours are available, as well as with "Prev" button the past heatmaps.
- Air Quality Index heatmap: real time heatmap of air quality index of the Helsinki area, provided by the FMI. The resulting index from 1 to 10 indicates the quality of air. The heatmap is upded every 2 hours. On the Heatmap Controls widget: the animated values of the entire 24 hours are available, as well as with "Prev" button the past heatmaps.
- EAQI: real time heatmap of European Air Quality Index. The resulting index from 1 to 5 indicate the quality of air. On the Heatmap Controls widget: the animated values of the entire 24 hours are available, as well as with "Prev" button the past heatmaps.
- CAQI: real time heatmap of Common Air Quality Index. The index is defined away from roads (a "background" index). CAQI is computed on the basis of NO2, PM10 ,O3 and PM2.5. On the Heatmap Controls widget: the animated values of the entire 24 hours are available, as well as with "Prev" button the past heatmaps.
- Enfuser pred. AQI: heatmap of Air Quality Index hourly Enfuser predictions. The animatedpredictions of the entire 24 hours are available, clicking on the "Next" button on the Heatmap Controls widget you can see the forecast.
- Enfuser pred. PM10: heatmap of PM10 particles hourly Enfuser predictions in µg/m3. The animated predictions related to the entire 24 hours are available, clicking on the "Next" button on the Heatmap Controls widget you can see the forecast.
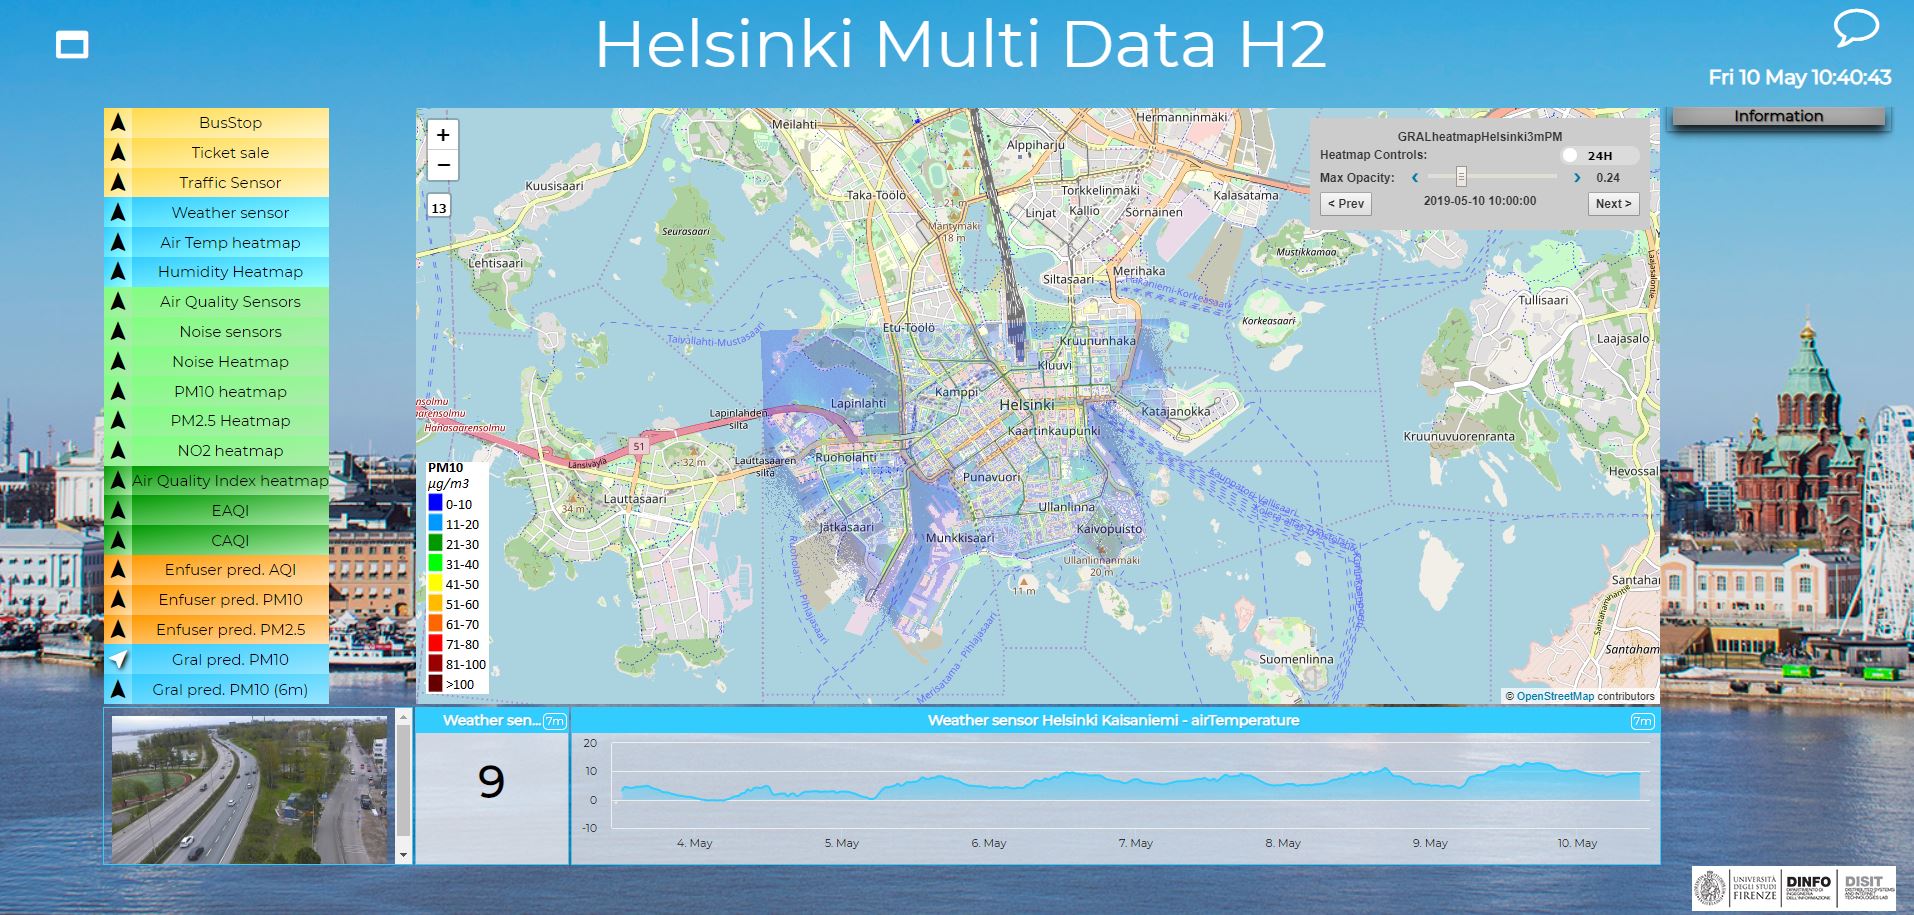
- Gral pred. PM10: heatmap of PM10 particles hourly predictions in µg/m3 measured 3 meters on the ground and computed using Gral model. The predictions related to the entire 24 hours are available, clicking on the "Next" button on the Heatmap Controls widget you can see the forecast.
- Gral pred. PM10 (6m): heatmap of PM10 particles hourly predictions in µg/m3 measured 6 meters on the ground and computed using Gral model. The predictions related to the entire 24 hours are available, clicking on the "Next" button on the Heatmap Controls widget you can see the forecast.
- PM10 Jätkäsaari: real time heatmap of pollutant levels in air in terms of PM10 (measured in µg/m3) particles in the Jätkäsaari Helsinki area. The heatmap is updedd every 1 hour. On the Heatmap Controls widget: the animated values of the entire 24 hours are available, as well as with "Prev" button the past heatmaps.
- PM2.5 Jätkäsaari: real time heatmap of pollutant levels in air in terms of PM2.5 (measured in µg/m3) particles in the Jätkäsaari Helsinki area. The heatmap is upded every 1 hour. On the Heatmap Controls widget: the animated values of the entire 24 hours are available, as well as with "Prev" button the past heatmaps.
- EAQI Jätkäsaari: real time heatmap of European Air Quality Index. The resulting index from 1 to 5 indicate the quality of air on the basis of the sensors in the Jätkäsaari Helsinki area. On the Heatmap Controls widget: the animated values of the entire 24 hours are available, as well as with "Prev" button the past heatmaps.
Below the Selector on the left you can see:
- A camera monitoring the traffic situation in Helsinki.
On the Map, several information may appear:
- PINs about POI where you can select a PIN to see information
- Name
- Description
- Details (Location and Adress)
- PINs about sensors where you can select a PIN to see information
- Details
- Description
- Real Time data: clicking on one of the buttons under the heading "Buttons" (Last Value, Last 4 hours, 24 hours, 7 days, and last 30 days) the trend below the map change in according to the selected sensor and time values (the name of each measred sensors can be found under the heading "Description"). The heading "Value" indicates the realt time measuring for each sensors description (according to the last update).
- Heatmap Information pop up when you click on a point of the map
- Heatmap Controls widget positioned at the top right of the map with the name of the Heatmap
- Opacity: the slider that can be used to correct the opacity of the map
- "Next" and "Prev": the buttons can be used to display maps related to different date and times
- Animation: the swich "24H" to make the animation of the heatmaps related to the previous 24 hours
- the legenda of the heatmap positioned at the bottom left of the map
Below the Map:
- the initial single value is referring to air temperature of: Weather sensor Helsinki Kaisaniemi
- The initial trend value is referring to air temperature of: Weather sensor Helsinki Kaisaniemi
- both single value and trend are used to visualize the data selected on the map, see above
The data of this dashboard have been collected by Snap4City according to the PCP lanched by Select4Cities project.
The data sources used for creating this dashboard are listed in the following web pages:
Helsinki: https://www.snap4city.org/drupal/node/364
Antwerp: https://www.snap4city.org/drupal/node/363
 European Commission Affiliation Select4Cities project has received funding from the European Union’s Horizon 2020 research and innovation programme under grant agreement No 688196. Please note that this website represents the view of Snap4City, with the support of Select4Cities project and that the Commission is not responsible for any use that may be made of the information it contains.
Comments
Heatmaps last update
irene.paoli - Fri, 05/03/2019 - 12:51Note that, the heatmaps last update depends on the availability of the real-time data.