
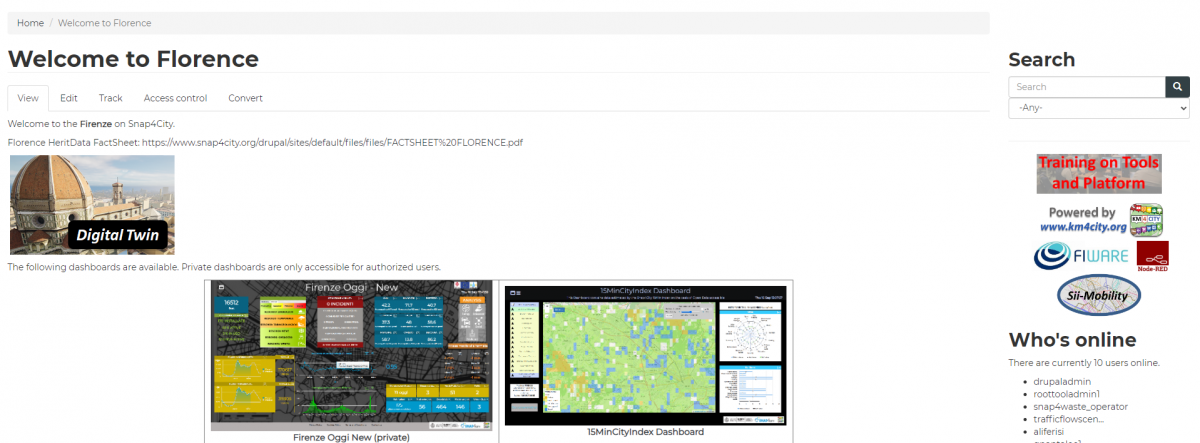
Welcome to the Florence on Snap4City.
Set in the heart of Tuscany, Florence is renowned worldwide as the cradle of the Renaissance and the global capital of 15th-century art. Its city centre, spanning approximately 5 km², has been a UNESCO World Heritage site since 1982 and houses some of the most famous museums in Europe and the world. The main characteristic of this pilot area is the high density of cultural heritage sites, which, coupled with the significant tourist influx, results in a substantial tourism impact throughout much of the year. The City of Florence is facing challenges to enhance its resilience through more sustainable tourism practices and needs to continue expanding the use of data for more detailed and comprehensive tourism-related analyses, ensuring that Florence remains a vibrant and sustainable destination that benefits both residents and visitors alike.
The following dashboards are available.
|
|
 |
 |
 |
|
|
|

The main functionalities of those dashboards are described below.
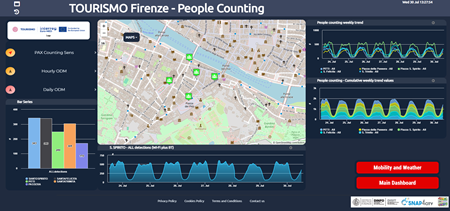
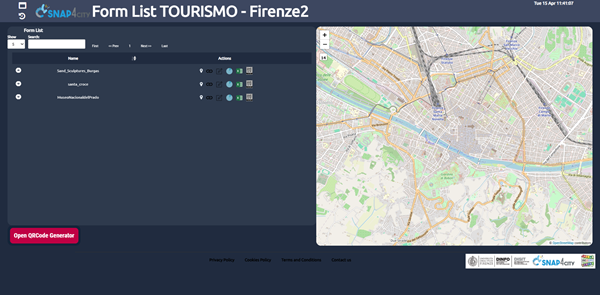
The main dashboard TOURISMO Florence is divided in two main areas:
- A selector on the left that allows to activate/deactivate the visualization of data on the map. The popup on the sensor is responsible for controlling the visualization on the time-trend under the map;
- The map representing the geographic area;
- The widget on the bottom part, below the map, with a single content showing the last value of a selected data, and a time trend widget representing the temporal data in a particular time period;
- On the left, redirection buttons are available for the “Mobility and Weather” and “People Counting” dashboards. “Mobility and Weather” contains data trend regarding entering/exiting vehicles from/to the municipality of Florence and weather data. “People Counting” contains data from sniffer devices. “Documentation” button links to this webpage.
The selector allows to shown/hide the following data represented as pins on the Map or activating specific advanced functionalities in the Florence Main Dashboard:
- SIR sensors: weather sensors regarding temperature, humidity, rain and wind in many locations of the municipality of Florence.
- Open Weathers: activate/deactivate the pins on the map representing the geographical position of the open weather sensors measuring weather data. By clicking the pin on the map a pop up is shown representing all the data measured by the sensor (i.e. air temperature, air pressure, air humidity, etc.).
- For each of the variable shown in the pop up in the column “Description”, it is possible to click on specific buttons (Last value, last 4 hours, last 24 hours, last 7 days, last 30 days, etc.) to see respectively the last value and the historical data represented in the widgets below the map.
- Arpat sensor: Air pollution values (NO2, CO, PM10, etc.) from ARPAT - Regional Agency for Environmental Protection in Tuscany - in many locations of the municipality of Florence.
- Air pollution: activate/deactivate the pins on the map representing the geographical position of the open weather sensors measuring air pollution. By clicking the pin on the map a pop up is shown representing all the data measured by the sensor (i.e. CO, PM10, PM2.5, NO, NO2, etc.).
- For each of the variable shown on the pop up in the column “Description”, it is possible to click on specific buttons (Last value, last 4 hours, last 24 hours, last 7 days, last 30 days, etc.) to see respectively the last value and the historical data represented in the widgets below the map.
- Car parking: showing data regarding parking availability in different parking locations of the municipality of Florence.
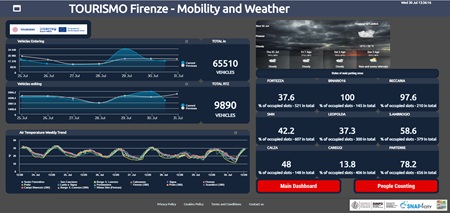
The dashboard TOURISMO Florence – Mobility and Weather contains data trend regarding entering/exiting vehicles from/to the municipality of Florence, Air Temperature Weekly Trend in different locations and some information about parking availability. Redirection button for Florence dashboards are also present.
The dashboard TOURISMO Florence – People Counting, which contains data from sniffer devices, is divided in three main areas:
- A selector on the left that allows to activate/deactivate the visualization of data on the map. The popup on the sensor is responsible for controlling the visualization on the time-trend under the map. The bar plot on the left displays the number of visitors recorded in the latest update, based on data collected by sniffers across the five locations in Oltrarno.
- The map representing the geographic area
- The widget on the bottom, below the map, with a single content showing the last value of a selected data, and a time trend widget representing the temporal data in a particular time period.
- On the right, the weekly trends of people data collected by sniffers are displayed and compared. A specific period can be selected by entering a date in the calendar in the top left corner. Redirections buttons are also present.
The selector allows to shown/hide the following data represented as pins on the Map or activating specific advanced functionalities in the Pilot Main Dashboard:
- Crowd Flow Monitoring: people flow monitoring via sniffers. The pin and the visualization shows the sensors data information such as the last number of sniffed visitors both Wifi, BLE or both. The popup on the sensor is responsible for controlling the visualization on the time-trend under the map. This data are used for the generation of Origin Destination Matrices;
- Hourly OD: Origin-Destination Matrices generated every hour;
- Daily OD: Origin-Destination Matrices generated every day;
Hourly OD and Daily OD open a tab on the top right corner of the map with some setting and control to:
- Switch the time period between week to months and viceversa;
- Switch the data between inflow and outflow;
- Modify the opacity of the ODM
- Move back and forward changing the date of the data to be shown.
In the ODM, the blue area represents the area of interest that has been selected. The coloured areas represent the inflow/outflow data to/from the selected area in percentage. The color of the areas are represented according to the colormap shown on bottom left in the map.
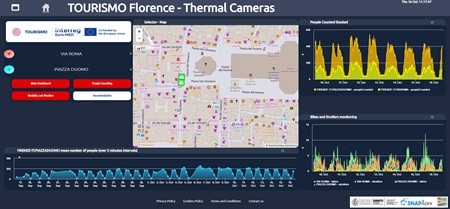
The dashboard TOURISMO Florence – Thermal Cameras, which contains data from installed thermal cameras, is divided in three main areas:
- A selector on the left that allows to activate/deactivate the visualization of data on the map. The popup on the sensor is responsible for controlling the visualization on the time-trend under the map. The number of people, bikes, and strollers are collected by two GDPR-compliant thermal cameras located in Piazza Duomo and Via Roma. Redirections buttons are also present.
- The map representing the geographic area
- The widget on the bottom, below the map, showing a time trend widget of the selected parameter representing the temporal data in a particular time period.
- On the right, both the weekly trends of people and bikes-strollers data collected by thermal cameras are displayed and compared.
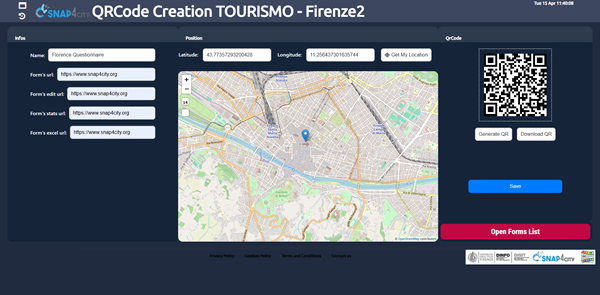
The webpage TOURISMO Bisevo – Sentiment Analysis provides a summary, generated by a Large Language Model (LLM), of the results obtained from the analysis of user satisfaction based on a questionnaire. The responses were collected through the Engaging City Users service, accessed via QR Code, as part of the TOURISMO project (https://www.snap4city.org/1081).
The TOURISMO Florence – Forecasting dashboard provides an automated approach for configuring and visualizing forecasts related to different measures. The left side allows the selection of the available devices for which predictions can be generated, while the right side is dedicated to the configuration of the forecasting parameters.
When a device is selected from the map, the configuration form is automatically updated to reflect the chosen device. The metric to be forecasted can then be selected, together with the forecasting model, either LSTM or Prophet. The Prophet model is recommended for sustainability reasons, as it can adapt to the observed data trend without requiring retraining. The configuration also includes the definition of the start date, which specifies the temporal starting point of the forecast, the prediction rate, expressed in minutes and representing the temporal resolution of each forecast step, and the slot number, which defines the total number of forecast steps to be generated from the selected start date.
After all required parameters have been configured, the computation is initiated by pressing the Submit button. Once the process is completed, the trend chart displayed below the map displays both the historical data of the selected metric and the corresponding forecast produced by the selected model. To use the forecasting tool, users must access the platform using a Snap4City account.
FORMER WELCOME PAGE AVAILABLE HERE
- TOURISMO Webpage on Snap4City
- Project web site: https://tourismo.interreg-euro-med.eu
- https://www.facebook.com/profile.php?id=61557381137979
- https://www.linkedin.com/company/tourismoproject/
Project kind: Interreg Euro-MED, cofounded by the European Union