The architectures for IoT (Internet of Things), IoE (internet of Every Things), WoT (web of things) and big data development tools based on microservices can be generalized and can be classified according to the following model in which the most relevant areas and connection among them are identified and described. In the next Figure, a conceptual architecture is presented in which the most relevant data flows among the main components are highlighted. Data/Control Flows are also drawn by corresponding control flow in the opposite direction, or identical in the case of event driven flows. Each module/block of the figure represents a functional area and not a single tool. For example, the Data Ingestion includes the set of tools, processes and services for data ingestion/production, and the same complexity is present in the Business Logic area, Data Analytics and Front-End areas, and thus also the Storage area may present multiple storages and processing. Identify management and access control are diffused in all the communications among all areas and tools.
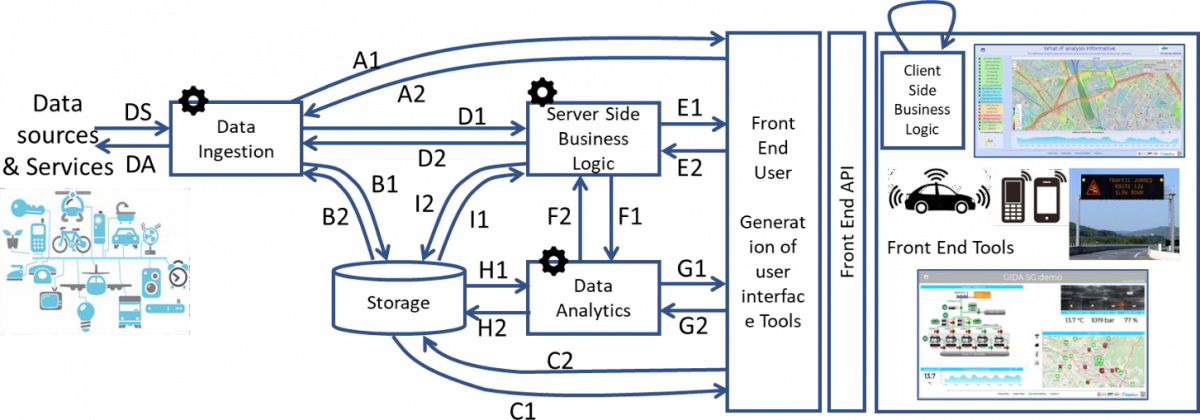
Figure – Conceptual Architecture, from simple to Advanced Smart City Solutions.
The early generation of smart city/IoT applications have been implemented by tools for open data management as well as by GIS (Geographic Information Systems) solutions. In those cases, the IoT data services managed data as Data Sensors / inflows (DS) and Data Actuators / outflows (DA), to store them in some Storage via B1 (may be indexed and retrieved via B2 or other channel) and rendered them asynchronously via C1. Typically, the Data Ingestion / transformation is performed with the so called ETL/ELT (extract transform/load load/transform) processing [MicroServices2019]. The arrival of IoT/IoE devices constrained to be more reactive (data/event driven, managing real-time data) in connecting DS/DA and data services, thus producing the needs of having A1 connections, possibly data/event driven. In that context, Data Ingestion tools have to be implemented by Brokers (also called IoT Brokers) to manage IoT Devices (Entities) via bidirectional protocols (C1/2 and B1/2). At the same time, for acting on the field, A2/A1 connection was activated to allow sending data and events from the User Interface to Brokers and Devices/Entities as signals/messages in event-driven mode.
Data Ingestion area is the areas in which a large number of data ingestion processes can be implemented and put in place to cope with many kind of data/entities gathered and produced: Entities Instances/IoT Devices (sensors and actuators, may be based on Smart Data Models, IoT Device Models, etc.), POI (Point of Interest), typical time trends, KPI, heatmaps, constrained scenarios, traffic flows, personal data, user profiles, maps, orthomaps, shapes, GIS data, trajectories, origin destination maps, scenarios, etc. They are produced exploiting a large number of protocols Https://www.snap4city.org/65.
IoT Edge / Edge solutions are located on the field and before the Data/Entity Ingestion area. They may include a number of the functionalities reported in the previous Figure (e.g., ingestion, local storage, business logic), while the substance does not change the general data and control flows. Typically, the Edge only includes the
Data Ingestion, which as described above, may include some data/entity transformation and exchange. In the case of Fog computing some Data Analytics mainly far from the Front End and may be not storing the results on some Storage but passing them to some other entity in the network.
Slightly more complex solutions could be those that need to perform some computing on stored data which can be performed only asynchronously due to their complexity (e.g., periodic processes). This problem can be solved by activating Data Analytic processes and services, exploiting connections H1/2 to read historical data entities and write results back (for example for computing some machine learning, simulation, predictions, early warning, anomaly detection, heatmaps, origin destination matrices, KPI, etc., saving results or derived trained models). The results can be made accessible on the user interface via C1, once saved in the Storage Area, or via I1/E2 if some Business Logic arrangement is needed. In some cases, the results can be passed back to the Business Logic without saving via F1/F2. Otherwise, via G1 the analytics results can be provided on the user interface on the fly without saving values (assuming that the results are just a temporary exploration), that is the classic path of Business Intelligence tools.
Typical smart city applications and services need to compute predictions/simulations, analysis on the basis of historical and contextual data. Examples of smart applications and services exploit computing tools are: smart irrigation (deciding the best irrigation time), smart parking publishing free parking slot predictions, optimizing routing for waste collection, multimodal routing for final users, and for computing origin destination matrices, heatmaps, anomaly detections as early warning, etc. The computations could be performed periodically or on demand. The results are usually saved on Storage via communication and services, such H1/2 connections. The Data Analytics processes may also need to directly interact (via G1/2) with the front-end layer in which the user interface content is produced (production of HTML pages, streams, etc.) for the devices such as web and mobile App, Dashboard, digital signage, etc.
Recently, in the context of Smart City, IoT/IoE, industry 4.0, WoT, a number of complex smart applications are demanded by Decision Makers for city management and Control Rooms (with the aim of implementing workflow management, simulation and what-if analysis), developing complex workflows in short time, with frequent updates and modifications of data analytics parameters, data flow, workflow, and business logic / Intelligence on the user interface. To this aim, most of the smart solutions integrated the possibility of implementing a Business Logic module with workflows/dataflows (exploiting E1/2, F1/2 and I1/2 connections), thus including multiple connections for real time data driven flows (D1/2, E1/2), as in Figure 1. To this end, most of the development environments exploit traditional programming languages (such as AWS, MS Azure IoT, etc.), while in some other cases visual languages and MicroServices are used (e.g., Node-Red by JS foundation [MicroServices2019]). Thus, the capability of the solution highly depends, in practice, on the flexibility of the Business Logic/Workflow, which in turn exploits API and MicroServices, and thus on the integration of the user interface to create smart applications with the development environment and data flow. These smart applications can be regarded as custom Business Intelligence tools. In the case of Business Intelligence tool, as well as in Visual Analytics the Business Logic defining the actions in response to the user interaction can be on client side or on server side. Client-Side Business Logic, CSBL, allows each user to see its own experience on Front-End without loading the server side of many contextual information for each user. Server-Side Business Logic, SSBL, may be realized by taking into account the context of the user interaction or without it. In the former case, it can be used to share the user experience with many users for example in control room and decision support contexts.
Thus, the implementation of smart applications and solutions can be realized by using microservices provided by the functional areas of the previous Figure and taking into account non-functional requirements. The development framework must enable developers to create advanced applications, and at the same time to support operators to keep the infrastructure under control, despite the complexity generated by multiple applications that may share the same platform, data, data driven processes, data analytic, and users’ tools at the same time.
The system interoperability with other solutions can be implemented via a number of API and formats that in Snap4City are more than 150:
- DA/DS: In Snap4City, Https://www.snap4city.org/65
- API of IoT Brokers,
- API for data ingestion and data submission,
- API for GIS,
- etc.
- Front-End API can provide access to Storage, Data Analytics and Business Logic to:
- C1/C2 API which are called Smart City API to query data from the storage,
- E1/E2 API for Server-Side Business Logic, with WebSocket connections
- A1/A2 API with brokers to send data directly on broker, and to recover data from brokers.
- Broker, IoT Broker API, IoT Devices / Entity Instances, IoT Edge Devices / Edge processing tools and devices, etc.
- G1/G2 API for exploiting the Data Analytics of any kind,
- API and call back for Client-Side Business logic,
- external applications: web and mobile App, digital signage, navigators,
- Processing Logic interoperability, which is in Node-RED + Snap4City Libraries of MicroServices:
Front-End API as above described.
[MicroServices2019] C. Badii, P. Bellini, A. Difino, P. Nesi, G. Pantaleo, M. Paolucci, “MicroServices Suite for Smart City Applications”, Sensors, MDPI, 2019. https://doi.org/10.3390/s19214798 Https://www.snap4city.org/download/video/MicroServices2019.pdf