|
Test Case Title |
TC4.9: New Support Widgets for Bars Series and Multi Series, on Dashboards and IOT Applications |
|
Goal |
the show of data dynamically on a Widget into the Dashboard, as bars, staked barseries, time series, staked time series, kiviat, net diagrams, dunut, pie, multipie, etc. etc. |
|
Prerequisites |
the Users has to capable to use and IOT App, and know a little of JavaScript and HTML |
|
Expected successful result |
Activate a dashboard in which dynamic data cam be shown from IOT App and thus for shiwing any kind of single content. |
|
Steps |
|
| installation info | into the dashboard builder . |
see also tables summarizing: HOW TO: HLT vs Ingestion, and HLT vs Widgets
The wizard is going to present a new column that is called “value unit”. It values can be: PPM, mg/m3, C, F, Euro, etc… that is the concept of unit of measure already addressed on all HLT of kind “sensor” which are the majority of data passing into KB and IOT. The value presented in the diagram is the last value of sensor time series. On this regard, the data kind Dictionaries is available for the higher roles and on premise soon.
An integrated exmaple https://main.snap4city.org/view/index.php?iddasboard=Mjk5NQ==

Selecting homogenous sensors for “value unit” is possible on wizard to create:
Multi value Barcharts (vertical and horizontal, normal and staked)


See https://www.snap4city.org/dashboardSmartCity/view/index.php?iddasboard=ODM=
See also: https://www.snap4city.org/dashboardSmartCity/view/index.php?iddasboard=MjQwMA==

Only starting from Wizard and editing details on “more Options” in editing the widget, with a higher level of flexibility with respect to now that is working on native Metrics of Dashboard builder…. That is less flexible.
Presently this feature is available for:
-- HLT sensors (coming from IOT or ETL as well, showing the last value of the time series if any), with ServiceURI as MetricID
-- HLT MyPersonal Data
-- HLT KPI/ Metrics (which are metrics that you can create by using SQL in your on premise version, or those that are offered for you, or if you have on cloud the user level to do it)
-- HLT MyKPI (also adding the concept of “value unit” on MyKPI, see the new column on Dashboard Wizard)
-- Dynamic values and variables can be sent to a barseries without the need of having defined them as MyKPI or other variable in the system. So that you can create fully dynamic barseries from an IOT App into a Dashboard widget and you can mix dynamic values with those defined and taken from historical data, from KPI, from sensors, etc.
-- grouping/staking with variables into the same Device, so that you can create a device with 3 values (e.g., called A, B and C) and see them staked/sommed if they have the same value_unit. This can be used for creating staked graph / bars representing some conditions. E.g., the percentage of of time spent on: Moving, walking, running during the day. This is implemented by a flag in the more-option of the widget that allow to exchange the groupingmodel.
The IOT App can dynamically creates/changes the widget on the Dashboard at run time, according to some event of data. This allowd to all users to create their dynamic dashboard which can adapt the data to be shown according to the events and data collected without changing manually the dashboard.
The Snap4City suite on Node-RED has been updated at the release time.
Presently some online help into the NodeRED can be not updated.
for example the MSG.payload to be sent at the barseries node could be as follows. The last metric has no valid MetricID so that is is a dynamic variable fully defined on the fly.
An integrated exmaple https://main.snap4city.org/view/index.php?iddasboard=Mjk5NQ==
[
{
"metricId": "http://www.disit.org/km4city/resource/tusc_weather_sensor_ow_3166540",
"metricHighLevelType": "Sensor",
"metricName": "tusc_weather_sensor_ow_3166540",
"metricType": "airTemperature"
},
{
"metricId": "http://www.disit.org/km4city/resource/tusc_weather_sensor_ow_3182522",
"metricHighLevelType": "Sensor",
"metricName": "tusc_weather_sensor_ow_3182522",
"metricType": "airTemperature"
},
{
"metricId": "17057447",
"metricHighLevelType": "MyKPI",
"metricName": "OBD2 - Intake Air Temperature",
"metricType": "Temperature"
},
{
"metricId": "17056579",
"metricHighLevelType": "MyKPI",
"metricName": "OBD2 - Intake Air Temperature",
"metricType": "Temperature"
},
{
"metricId": "",
"metricHighLevelType": "Dynamic",
"metricName": "BatteryGalaxyNote",
"metricType": "Temperature",
"metricValueUnit": "°C",
"measuredTime": "2019-11-21T14:51:00Z",
"value": 42
},
{
"metricId": "",
"metricHighLevelType": "Dynamic",
"metricName": "Storage",
"metricType": "Space",
"metricValueUnit": "Gb",
"measuredTime": "2019-11-21T14:51:00Z",
"value": 12
}
]
another example: the following is the JSON to be sent at the NODE called Barseries into the IOT App
[{"metricId":"http://www.disit.org/km4city/resource/tusc_weather_sensor_ow_3166540","metricHighLevelType":"Sensor","metricName":"tusc_weather_sensor_ow_3166540","metricType":"airTemperature"},{"metricId":"https://servicemap.disit.org/WebAppGrafo/api/v1/?serviceUri=http://www.disit.org/km4city/resource/tusc_weather_sensor_ow...","metricHighLevelType":"Sensor","metricName":"tusc_weather_sensor_ow_3182522","metricType":"airTemperature"},{"metricId":"17056320","metricHighLevelType":"MyKPI","metricName":"SiiMTuscanyTrackerLocation","metricType":"Velocity"},{"metricId":"","metricHighLevelType":"Dynamic","metricName":"BatteryTemperatureGalaxyNote","metricType":"Gradi Centigradi","metricValueUnit":"°C","measuredTime":"2019-11-21T14:51:00Z","value":55.395468539280635},{"metricId":"","metricHighLevelType":"Dynamic","metricName":"BatteryTemperaturemia","metricType":"Gradi Centigradi","metricValueUnit":"°C","measuredTime":"2019-11-21T14:51:00Z","value":51.396725502373464},{"metricId":"","metricHighLevelType":"Dynamic","metricName":"BatteryTemperaturemia","metricType":"airTemperature","metricValueUnit":"°C","measuredTime":"2019-11-21T14:51:00Z","value":29.150364690965127}]
showing staked bars with a mixt of metrics, KPI and Dynamic data totally generated from IOT App locally and randomsly. So that this widget can be found on the following Dashboard

in https://www.snap4city.org/dashboardSmartCity/view/index.php?iddasboard=MjQxNA==
Presently the staked is performed on the basis of identical VariableNames (metricNames) of the different devices (data sources), if they present the same value_unit, so that they are sommable.
Multi Time Series (normal, shaded and staked)
Also in this case they have to be of the same “value unit” and produced from Wizard


Active since 16th of January 2020
- starting from Wizard
- editing details on “more Options” in editing the widget, with a higher level of flexibility with respect to now that is working on native Metrics/KPI of Dashboard builder….
- The feature on Metrics is available since long time on the on-premise version or on cloud for high level users. So that it was less flexible. Metrics can be created by using SQL queries.
- Supporting HLT:sensors, over time
- Supporting MyKPI HLT, over time (may be over other …)
- The staked version works correctly when the different series present values at the same points along X axis, that could means to have temporal series aligned on sample time.
- see for example: https://www.snap4city.org/dashboardSmartCity/view/index.php?iddasboard=MjQ0OA==
- dynamically creating multiseries from IOT Applications with a renovated MicroService/node and Block, so that one should be capable to send programmatically any value and labels, etc. This allows to all users to create their own queries and processes to generate multi bar series, etc. The Snap4City suite on Node-RED has been be updated at the release time.
- browsing over time (previous and next period as in the "time trend" widget with the small arrows on the top right corner of the widget)
an exaple of mixed as sensor, mykpi and dynamic can be obtained as:
An integrated exmaple https://main.snap4city.org/view/index.php?iddasboard=Mjk5NQ==
[
{
"serviceUri": "http://www.disit.org/km4city/resource/tusc_weather_sensor_ow_3166540",
"metricHighLevelType": "Sensor",
"metricName": "tusc_weather_sensor_ow_3166540",
"smField": "airTemperature",
},
{
"serviceUri": "http://www.disit.org/km4city/resource/tusc_weather_sensor_ow_3176959",
"metricHighLevelType": "Sensor",
"metricName": "tusc_weather_sensor_ow_3176959",
"smField": "airTemperature"
},
{
"serviceUri": "17057458",
"metricHighLevelType": "MyKPI",
"metricName": "Room 1",
"metricType": "Temperature"
},
{
"metricId": "",
"metricHighLevelType": "Dynamic",
"metricName": "BatteryTemperatureGalaxyNote",
"smField": "Gradi Centigradi",
"metricValueUnit": "°C",
"values": [
[now-64*base, 19.5],
[now-60*base, 20.0],
[now-56*base, 20.5],
[now-52*base, 18.5],
[now-48*base, 19],
[now-44*base, 18.5],
[now-40*base, 21.5],
[now-36*base, 22.0],
[now-32*base, 19],
[now-28*base, 17.5],
[now-24*base, 16.5],
[now-20*base, 17.0],
[now-16*base, 18.5],
[now-12*base, 20.0],
[now-8*base, 19.5],
[now-4*base, 21.5],
[now-1*base, 21]
]
}
]
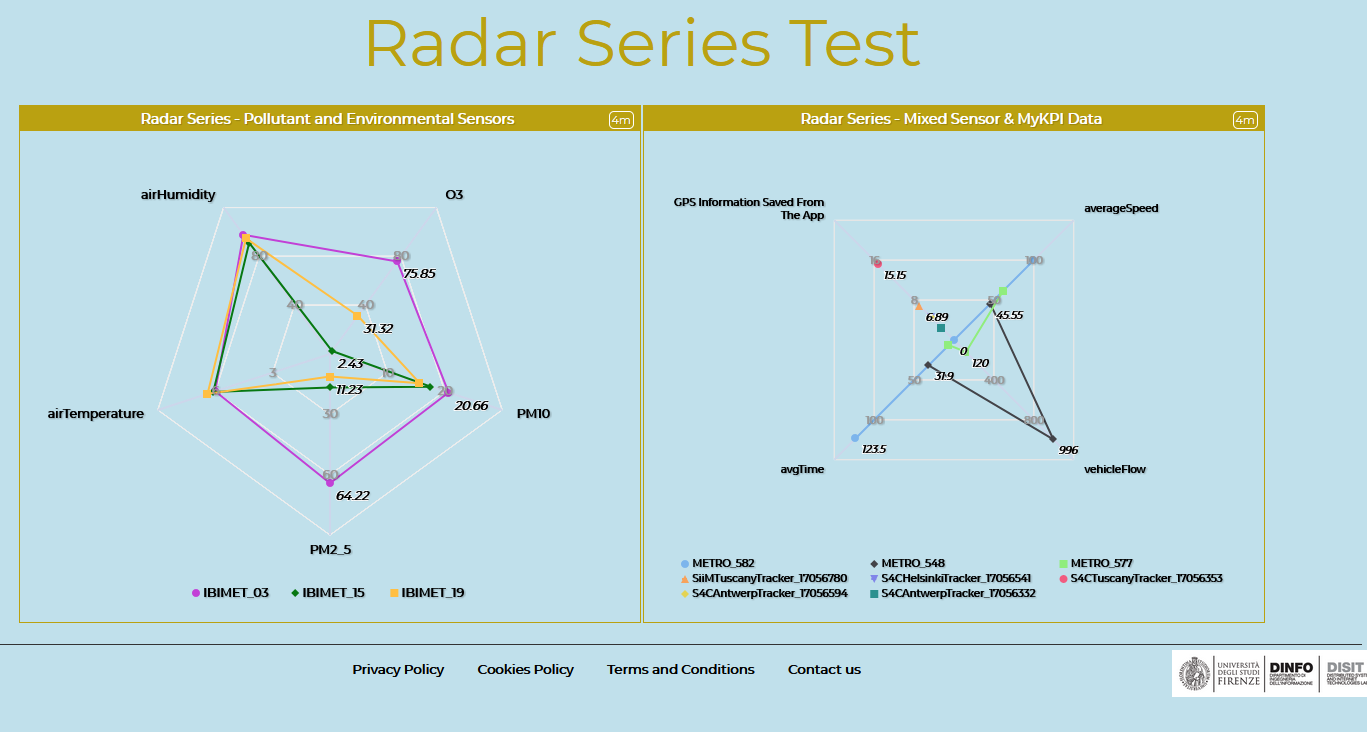
Kiviat (spidernet, radar as you prefer to call it)
in this case they can accord multiple “value unit”s and produced from Wizard
https://www.snap4city.org/dashboardSmartCity/view/index.php?iddasboard=MTAw


In place
- starting from Wizard
- editing details on “more Options” in editing the widget, with a higher level of flexibility with respect to now that is working on native Metrics/KPI of Dashboard builder….
- The feature on Metrics is available since long time on the on-premise version or on cloud for high level users. So that it was less flexible. Metrics can be created by using SQL queries.
- Supporting last values of sensors HLT
- Supporting last values of MyKPI HLT
https://www.snap4city.org/dashboardSmartCity/view/index.php?iddasboard=MjUwNQ==
- dynamically created from IOT Applications with a renovated MicroService and Block, so that one should be capable to send programmatically any value and labels, etc. This allows to all user to create their own queries and processes to generate multi bar series, etc. The Snap4City suite on Node-RED has beenbe updated at the release time.
for example: a fully dynamic kiviat is obtained with
An integrated exmaple https://main.snap4city.org/view/index.php?iddasboard=Mjk5NQ==
[
{
"mapName":"15MinIndex_FastMobilityIndex",
"metricName":"15Min Indexes",
"value":1,
"metricHighLevelType":"Dynamic",
"metricValueUnit":"",
"metricType":"Fast Mobility"
},
{
"mapName":"15MinIndex_GovernmentServicesIndex",
"metricName":"15Min Indexes",
"value":1,
"metricHighLevelType":"Dynamic",
"metricValueUnit":"",
"metricType":"Government Services"
},
{
"mapName":"15MinIndex_HealthIndex",
"metricName":"15Min Indexes",
"value":1,
"metricHighLevelType":"Dynamic",
"metricValueUnit":"",
"metricType":"Health"
},
{
"mapName":"15MinIndex_AverageIndex",
"metricName":"15Min Indexes",
"value":3,
"metricHighLevelType":"Dynamic",
"metricValueUnit":"",
"metricType":"Average"
},
{
"mapName":"15MinIndex_HousingIndex",
"metricName":"15Min Indexes",
"value":5,
"metricHighLevelType":"Dynamic",
"metricValueUnit":"",
"metricType":"Housing"
},
{
"mapName":"15Min Indexes",
"metricName":"Max Value",
"date":"2020-08-26T15:00:00.000Z",
"value":5,
"metricHighLevelType":"Dynamic",
"metricValueUnit":"",
"metricType":"Fast Mobility",
"measuredTime":"2020-08-26T15:00:00.000Z"
},
{
"mapName":"15Min Indexes",
"metricName":"Max Value",
"date":"2020-08-26T15:00:00.000Z",
"value":5,
"metricHighLevelType":"Dynamic",
"metricValueUnit":"",
"metricType":"Government Services",
"measuredTime":"2020-08-26T15:00:00.000Z"
},
{
"mapName":"15Min Indexes",
"metricName":"Max Value",
"date":"2020-08-26T15:00:00.000Z",
"value":5,
"metricHighLevelType":"Dynamic",
"metricValueUnit":"",
"metricType":"Average",
"measuredTime":"2020-08-26T15:00:00.000Z"
},
{
"mapName":"15Min Indexes",
"metricName":"Max Value",
"date":"2020-08-27T08:00:00.000Z",
"value":5,
"metricHighLevelType":"Dynamic",
"metricValueUnit":"",
"metricType":"Housing",
"measuredTime":"2020-08-27T08:00:00.000Z"
},
{
"mapName":"15Min Indexes",
"metricName":"Max Value",
"date":"2020-08-27T08:00:00.000Z",
"value":5,
"metricHighLevelType":"Dynamic",
"metricValueUnit":"",
"metricType":"Health",
"measuredTime":"2020-08-27T08:00:00.000Z"
},
{
"mapName":"15Min Indexes",
"metricName":"Suff. value",
"date":"2020-08-26T15:00:00.000Z",
"value":3,
"metricHighLevelType":"Dynamic",
"metricValueUnit":"",
"metricType":"Health",
"measuredTime":"2020-08-26T15:00:00.000Z"
},
{
"mapName":"15Min Indexes",
"metricName":"Suff. value",
"date":"2020-08-26T15:00:00.000Z",
"value":3,
"metricHighLevelType":"Dynamic",
"metricValueUnit":"",
"metricType":"Housing",
"measuredTime":"2020-08-26T15:00:00.000Z"
},
{
"mapName":"15Min Indexes",
"metricName":"Suff. value",
"date":"2020-08-26T15:00:00.000Z",
"value":3,
"metricHighLevelType":"Dynamic",
"metricValueUnit":"",
"metricType":"Government Services",
"measuredTime":"2020-08-26T15:00:00.000Z"
},
{
"mapName":"15Min Indexes",
"metricName":"Suff. value",
"date":"2020-08-27T08:00:00.000Z",
"value":3,
"metricHighLevelType":"Dynamic",
"metricValueUnit":"",
"metricType":"Health",
"measuredTime":"2020-08-27T08:00:00.000Z"
},
{
"mapName":"15Min Indexes",
"metricName":"Suff. value",
"date":"2020-08-27T08:00:00.000Z",
"value":3,
"metricHighLevelType":"Dynamic",
"metricValueUnit":"",
"metricType":"Fast Mobility",
"measuredTime":"2020-08-27T08:00:00.000Z"
}
]
A mixt of referred data and dynamic data can be obtained by using:
[
{
"metricId": "http://www.disit.org/km4city/resource/tusc_weather_sensor_ow_3166540",
"metricHighLevelType": "Sensor",
"metricName": "tusc_weather_sensor_ow_3166540",
"metricType": "airTemperature"
},
{
"metricId": "http://www.disit.org/km4city/resource/tusc_weather_sensor_ow_3166540",
"metricHighLevelType": "Sensor",
"metricName": "tusc_weather_sensor_ow_3166540",
"metricType": "airHumidity"
},
{
"metricId": "http://www.disit.org/km4city/resource/tusc_weather_sensor_ow_3176959",
"metricHighLevelType": "Sensor",
"metricName": "tusc_weather_sensor_ow_3176959",
"metricType": "airHumidity"
},
{
"metricId": "http://www.disit.org/km4city/resource/tusc_weather_sensor_ow_3176959",
"metricHighLevelType": "Sensor",
"metricName": "tusc_weather_sensor_ow_3176959",
"metricType": "airTemperature"
},
{
"metricId": "17056579",
"metricHighLevelType": "MyKPI",
"metricName": "OBD2 - Intake Air Temperature",
"metricType": "Temperature"
},
{
"metricId": "",
"metricHighLevelType": "Dynamic",
"metricName": "My Home",
"metricType": "airTemperature",
"metricValueUnit": "°C",
"measuredTime": "2019-11-21T14:51:00Z",
"value": 31
},
{
"metricId": "",
"metricHighLevelType": "Dynamic",
"metricName": "My Home",
"metricType": "Temperature",
"metricValueUnit": "°C",
"measuredTime": "2019-11-21T14:51:00Z",
"value": 28
},
{
"metricId": "",
"metricHighLevelType": "Dynamic",
"metricName": "My Home",
"metricType": "airHumidity",
"metricValueUnit": "%",
"measuredTime": "2019-11-21T14:51:00Z",
"value": 25
}
]
Pie/Donut, Solar (1 layer, multilayer)
In this case, the values listed on PIE (single layer) have to be numbers of the same “value unit”, and at the second layer they are counted in their number…


- starting from Wizard
- editing details on “more Options” in editing the widget, with a higher level of flexibility with respect to now that is working on native Metrics/KPI of Dashboard builder….
- The feature on Metrics is available since long time on the on-premise version or on cloud for high level users. So that it was less flexible. Metrics can be created by using SQL queries.
- Supporting last groups of POI/sensors HLT
- Supporting last groups of MyKPI HLT
- exchaging the two layers into the douple layer pie also called Donut.
- dynamically created from IOT Applications with a renovated MicroService and Block, so that one should be capable to send programmatically any value and labels, etc. This allows to all user to create their own queries and processes to generate multi bar series, etc. The Snap4City suite on Node-RED has been updated at the release time.
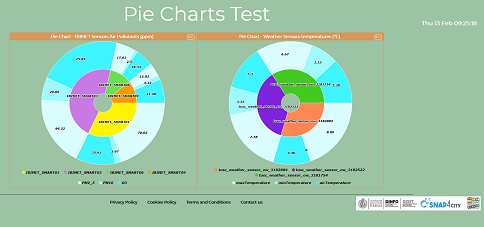
https://www.snap4city.org/dashboardSmartCity/view/index.php?iddasboard=MjUxNw==
The version with exchanged layer 1 and Layer 2 is accessible on: https://www.snap4city.org/dashboardSmartCity/view/index.php?iddasboard=MjUyNw==
Tables
Also tables can be created from the Wizard, including: Sensor, MyKPI, My Data, etc.
Values can be numeric or textual. Longer text are marked with ellipse.
Table cells can be automatically colored on the basis of the colors defined in a ColorMap. Each colum may have a different color map. The columns in the table can be used also without the colormap.
The table with colormap is a suitable and immediate representation for environmental parameters as well for any other kind of visualization (color maps can be regarded as code color for immediate reading and can be assocaited to threshols for example). The Color Maps can be defined by using the ColorMap Editor which is accessible for RootAdmin. So ask to the RootAdmin to create a new color map model, in the Resource Manager.

https://www.snap4city.org/dashboardSmartCity/view/index.php?iddasboard=MjUzMw==
- starting from Wizard
- editing details on “more Options” in editing the widget, with a higher level of flexibility with respect to now that is working on native Metrics/KPI of Dashboard builder….
- The feature on Metrics is available since long time on the on-premise version or on cloud for high level users. So that it was less flexible. Metrics can be created by using SQL queries.
- Supporting last groups of POI/sensors HLT
- Supporting last groups of MyKPI HLT
- dynamically created from IOT Applications with a renovated MicroService and Block, so that one should be capable to send programmatically any value and labels, etc. This allowd to all user to create their own queries and processes to generate multi bar series, etc. The Snap4City suite on Node-RED hsa been updated at the release time.