|
Test Case Title |
TC4.7: Vehicles and Fleets Monitoring Telemetry via OBD2 and Tracker |
|
Goal |
View the telemetry data of a vehicle connected with an OBD2 dongle, save this data on the platform and see on the dashboards the trajectories relating to the saved telemetry data. |
|
Prerequisites |
Having a mobile device Having an OBD2-compatible means of transport Have an OBD2 dongle (Bluetooth Traditional or BLE) |
|
Expected successful result |
Create a Dashboard for monitoring Vehicles and Fleets via OBD2 and Tracker. The monitoring can be oriented to consumption, fuel, velocity, engine status, etc. |
|
Needed Snap4City Components |
1) on our platform: download and install the app, perform the registration, app configuration, create a dashboard showing the data you sleected on the traker widget 2) on premise, you need to have installed the SNAP4CITYMAIN VM, customize your app, and do the same things of point 1 |
The diagram below describes at a high level the connections among the various actors in this example. We have a car with a Bluetooth OBD2 Dongle that is paired with a mobile device that allows you to choose which telemetric data to analyze and send to Snap4City. If you want to send them on the Snap4city platform to make them persistent and analyze or display them on a dashboard on a widget like Tracker. and may be performing other data analytics and reports for the company and personal usage.

- Presently the App including the service is: "Tuscany where what.... km4city", https://play.google.com/store/apps/details?id=org.disit.toscana&hl=en
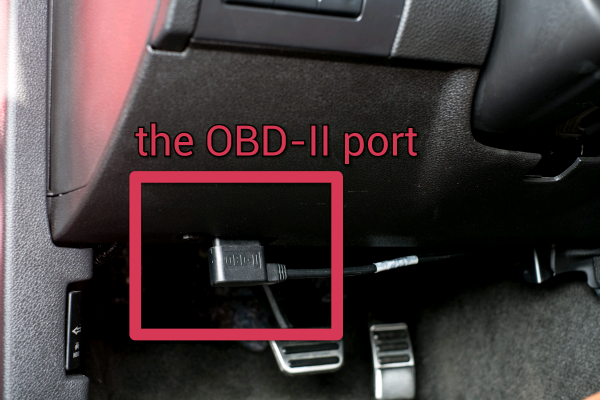
- The first step is to find in the means of transport (we will take the example of a car) the connector where to attach the OBD2 dongle: the connector is usually located in a flap below the steering wheel on the left, there are no controindication for the CAR since the device is only reading the data !!!
- The diagram below describes at a high level the connection between the various actors in play in this example. We have a car with a Bluetooth ODB2 Dongle that is paired with a mobile device that allows you to choose which telemetric data to analyze and if you want to send them on the Snap4city platform to make them persistent and analyze or display them on a dashboard on a widget like TrackerIn the main menu of the application click on the transport icon. In the "Transport" menu that opens, click on the icon with the engine symbol and the words "Driving Ecologically
- Presently the App including the service is: "Tuscany where aht km4city", https://play.google.com/store/apps/details?id=org.disit.toscana&hl=en

- If the Bluetooth dongle uses low energy Bluetooth (BLE) it can be connected directly from inside the application. Otherwise, in case of traditional bluetooth the association between mobile device and dongle must first be made directly from the bluetooth menu within the settings of the mobile device. The application shows all devices in the vicinity of the user. Obviously, the telemetry data and the application only work with devices that use the OBD2 protocol and it will not be possible to receive data from other Bluetooth devices.

- By clicking on the device of interest, which should be an OBD2 Bluetooth dongle, the telemetric data received from the car are continuously displayed and updated.

- Swipe to the right of a maximum of 5 telemetric values to create a sub-menu from which you can send such data on the platform as My KPI. The KPIs are automatically created and on these entities the averages of the telemetric data are then sent at fixed intervals.
In the following picture you can see what the phone shows when you have chosen 3 telemetric values to keep under control. At the top you can see a cloud with an arrow in the middle of the color. If this icon is of this color it means that we have enabled the sending of telemetry data on the Snap4city system. If we want to interrupt it, simply click on the cloud and it will become black without sending the data. To activate the data sending again, just touch up the cloud and make it turn green again.

- If the user connects to the Snap4city platform and goes to the KPI menu, he will see the saved telemetry data.

- Creating the dashboard that displays saved telemetry data is very intuitive and simple. When creating the dashboard, select the following template:

- In the next page only the private data saved by the user will appear and it will be sufficient to select through a textual search of "OBD2" the telemetric data coming from the dongle odb2.

- We select the correct widget that shows us the trajectories

- Instantiating the dashboard so selected we get what we can see in the following image
- which is public for demostration only: https://www.snap4city.org/dashboardSmartCity/view/index.php?iddasboard=MjIwNA==
