https://www.snap4city.org/dashboardSmartCity/view/Gea-Night.php?iddasboard=NDIzOQ==
Predictions
In order to compute predictons on some time series (such as traffic flow, parking, emission, etc.) specifi algorhtms should be set up to obtain high precise solutions/predictions. They are usually based on multiple features and not only the tempora series of the variable to be predicted.
in alternative, predictions can be obtained only on the basis of the temporal data of the same variable for which the prediction is needed.
In this case it is possible to use some generic ARIMA, RF, LST models such as in:
https://github.com/disit/snap4city/tree/master/Computing/predictions
Heatmaps
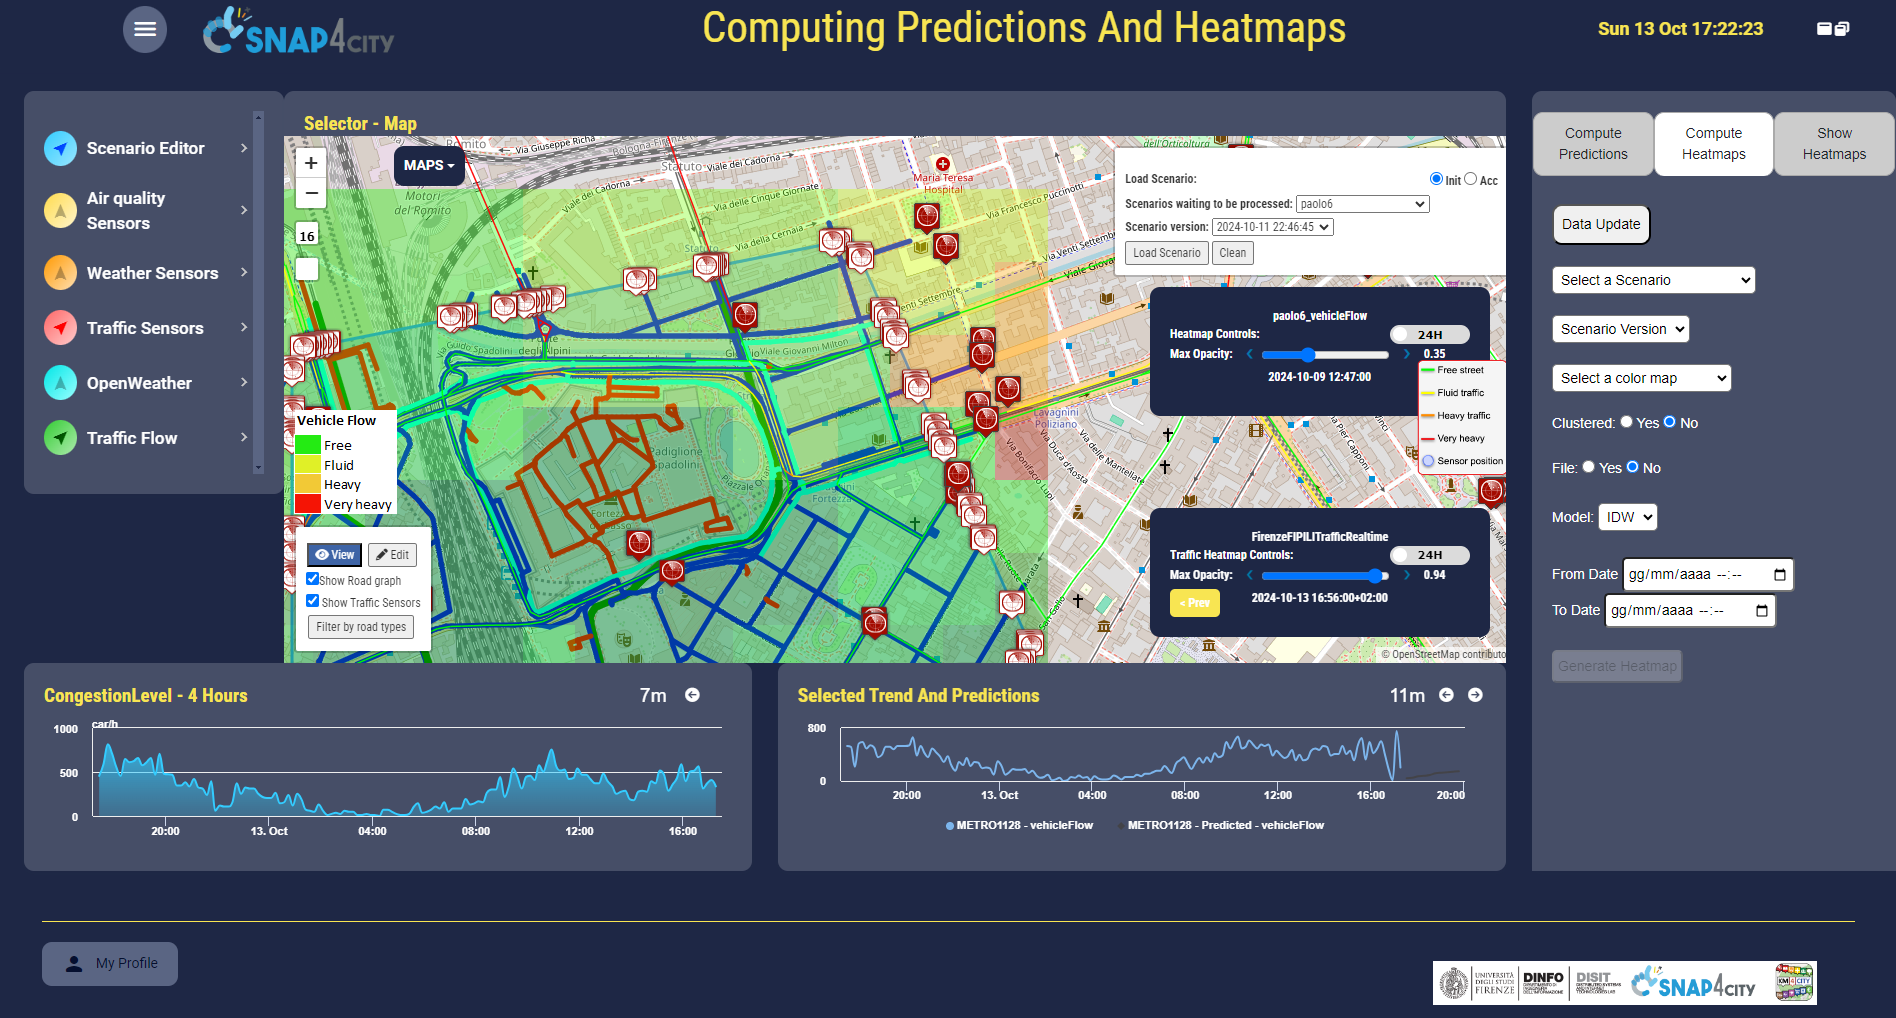
On the basis of some scenario the operator can define the an area on which it is interested to make/compute: (i) the traffic flow reconstruction, TFR; (ii) the heatmaps; etc.
On the scenario, one can include the data related to sensors (traffic flow, wheater, emissions, etc.). Sensors can be actual and accessible data from the storage as well as TTT typical time trends to simulate some specific conditions as well as what-if analysis:
https://www.mdpi.com/1424-8220/24/7/2225/pdf
The computation of the heatmap has a sense only if the a number of variables of the same kind are indentified in the scenario area. They are tpyically scattered, so that the heatmap is performing an interpolation. The interopolation can be performed by using some interpolated algorithms, splines, etc
See for this purpose: https://github.com/disit/snap4city/tree/master/Computing/predictions
Prediction API: https://github.com/disit/snap4city/blob/master/Computing/predictions/predictions_service.py
where you can fined: https://github.com/disit/snap4city/blob/master/Computing/predictions/heatmap.py ed altri file.
Heatmap API: https://github.com/disit/snap4city/blob/master/Computing/predictions/heatmap_service.py
Heatmap function: https://github.com/disit/snap4city/blob/master/Computing/predictions/heatmap.py
The perfect code to create and Heatmap which can be also retrieved and indexed on ServiceMap KB is:
1) create a device (from model, the model to be used can be the one standard or custom, be carefull to the HLT definition)
1.a) send a message on that device with the information of the Heatmap you are creating. Message sent to the Broker of the Device.
2) loading of metadata regarding the heatmap, with similar data of 1.a), but this will be performed toward the HeatMap manager
3) loading of all data of the heatmaps, and then closing the process.
The meaning of parameters and algorithm for computing the heatmap is described in https://www.snap4city.org/457
and https://www.snap4city.org/641
Once loaded the Heatmap cand be previewed on the Heatmap Manager from t he left side menu on Data Management HLT