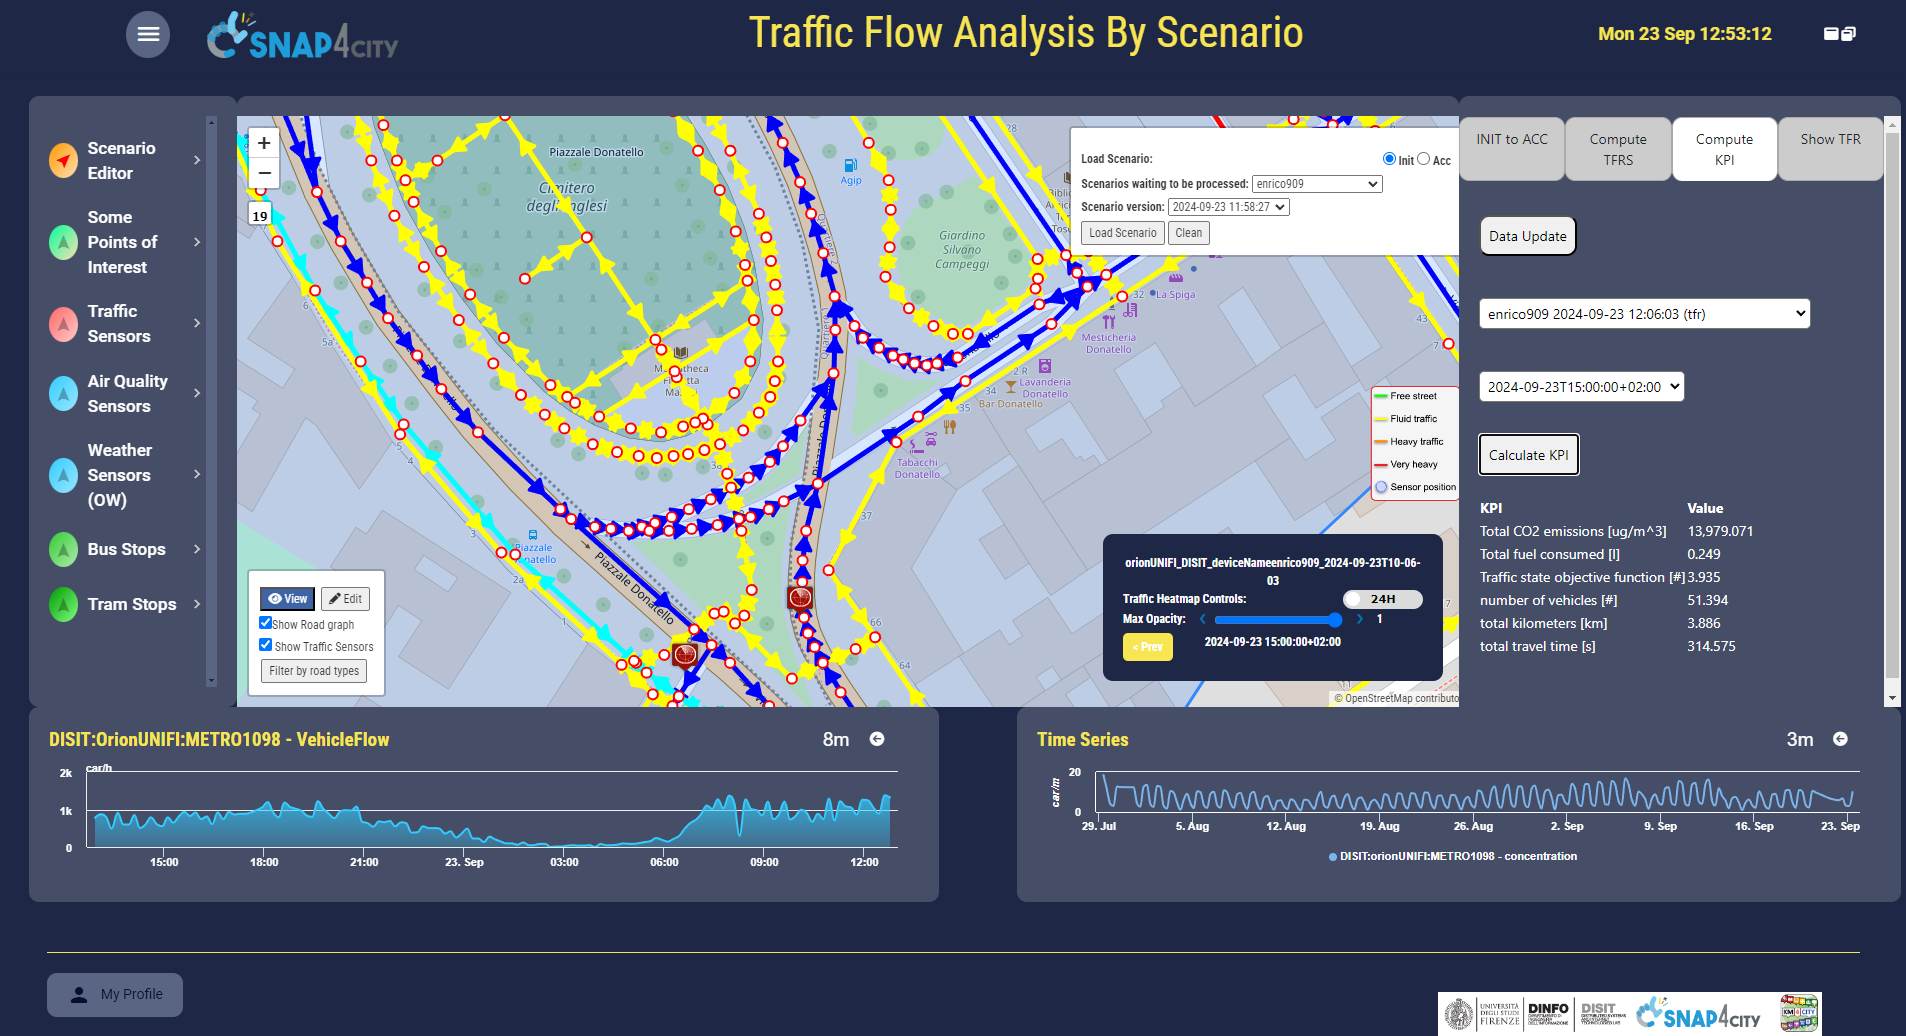
Figure 2. Snap4City Dashboard for Traffic Flow Analysis. The web-based scenario editor (which can be actived in any map) is used to create and modify a scenario. Right side presents business logic for What-if analysis and optimization. Once defined the area of interest (light transparent blue area), the Scenario is loaded (in operation or saved) providing interactive linesegments colored according to their type (blue for public roads, red for service/private roads, gray for closed roads, yellow for pathways, etc.). Real traffic sensors (dark red pins) and virtual border traffic sensors (white pins) are shown on the map. Note that virtual sensors are required in order to power up the TFR (Traffic Flow Reconstruction [28]) with flows entering and exiting the scenario area. Additional entities can also be included, as in this example, roads, POIs (rendered with red pins), bus stops (blue pins), etc. All the entities, roads and pins, can be modified by the user to address specific problems.
https://www.snap4city.org/dashboardSmartCity/view/Gea-Night.php?iddasboard=NDI1MQ==
To understand how works the simulation of Traffic Flow, traffic flow reconstruction, this page is describing the components.
The actual algorithm for TFR is not released in Open Source, plase contact snap4city@disit.org
Description
On the basis of some scenario the operator can define the an area on which it is interested to make/compute: (i) the traffic flow reconstruction, TFR; (ii) the heatmaps; etc.
On the scenario, one can include the data related to sensors (traffic flow, wheater, emissions, etc.). Sensors can be actual and accessible data from the storage as well as TTT typical time trends to simulate some specific conditions as well as what-if analysis:
https://www.mdpi.com/1424-8220/24/7/2225/pdf
The TFR is the algorithm to pass from (i) the scattered data of traffic flow measured from sensors on some points, to (ii) the traffi flow density in ll segment of the road graph.
So that have a scenario to identify an area, and associating some traffic flow sensors or TTT in specific borders points and/or scenario road graphs, it is possible to estimated traffic flow data in all segments of the ares.
Snap4City provides some API and modules writtend in python or Rstudio to compute on the basis of some referring scenario:
- Computing Accorpated graph, ACC: passing from the road graph of a scenarion including micro-segments, on the straight roads connecting junctions, haveing a lenght, a classification, number of lanes, etc.
- Computing TFR: Computing a FAKE traffic flow reconstruction and saving the TFR on snap4city platform accrding to the graph accorpated, ACC. This code and flow is just to allow you understand how the Traffic Flow reconstruction saving is working. The actual TFR algorithm has to be requested to Snap4city@disit.org. Once the TFR is saved as shown in the TFR demo.R file, it is possible to load on dashboards and visualize on digital twin 3D, etc. And it is also possible to compute some KPI.
- Computing KPI: computing actual KPI on the basis of a produced TFR, for example computing the lenght, the amount of emissions, the amount of consumed fuel, etc. If you do not have the computed a real TFR the computation is performed on the fake TFR produced.
- https://github.com/disit/snap4city/tree/master/Computing/kpi
-
KPI Value Total CO2 emissions [ton] 0.053 Total fuel consumed [L] 1.165 Traffic state objective function [#] 10.656 number of vehicles [#] 196.00 total kilometers [km] 10.157 total travel time [s] 900.00
The computing ACC, TFR and KPI processes can be loaded on containers to be used as microservices and made accessible from CSBL dashboards, as well as from IoT Apps.
In this section, the workflow architectural overview including all the components which are needed to perform a range of solutions covering operation and plan for the Digital Twin platform are presented. In Figure 1, the representation of the main elements of the Snap4City platform supporting the activities on the digital twin ranging from: predictions, classification, anomaly detection, simulation, optimization, estimation of KPI, etc., is shown. According to this model, the platform has been used to implement a number of solutions as described in the following, and many others can exploit the same management model. In the platform, static and real-time data are modelled and ingested contributing to one or more digital twins. Thanks to the 2D and 3D interactive dashboard engine, the data can be presented to the user via dashboards and views, which are the user interactive interface of the solutions such as those for to perform: monitoring, control, action, what-if analysis, simulation, optimization, etc., which are elements of the decision support systems.
In Figure 1, from the digital twin data, specific information can be derived / produced by means of analytic processes in operation. Such a possibility is highlighted with orange arrows, showing, for example, analytics for: predictions, traffic flow reconstruction, routing, heatmap computation, estimation of origin-destination matrices, etc., can be used starting directly from the static, historic, and real-time data previously ingested. Obtained results and KPIs may be sent back to the digital twin to be stored and eventually analyzed on some dashboard on user request. In the case of time trend data, predictions can be carried out before passing the predicted data to the analytics and obtain results valid for future time windows. This approach is an example of functional activity of the digital twin in operation, encompassed in the light orange pane, from which it is possible to keep under control the urban environment and perform actions through actuator devices. Please note that for the operation (monitoring, control, predict, etc.) the creation of largely modified instances of Digital Twin in operation are typically not needed, while a number of instances of data analytic processes may be needed, for example for computing: predictions, dynamic routing, KPIs, statistics, etc.
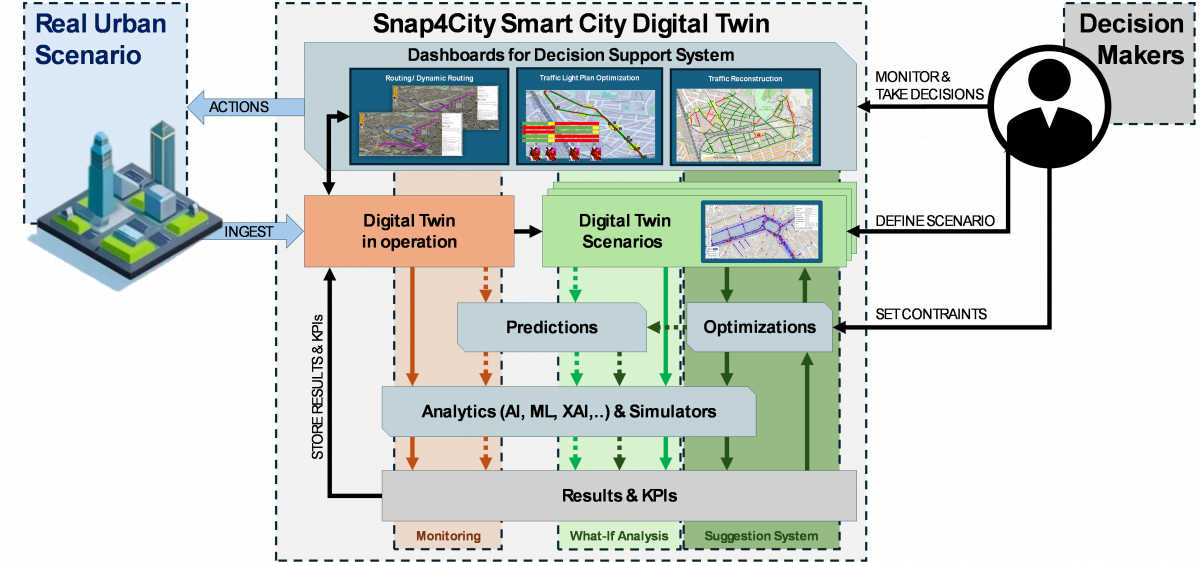
Figure 1. Representation of the main elements of the Smart City Digital Twin Snap4City platform for monitoring, what-if analysis, and producing prescriptions from optimization. Solid arrows describe the flow to simulate in real-time or by using historic data, dashed lines exploit predictions for computing simulations.
In order to perform what-if analysis, a more sophisticated architecture, data and process management, and a range of additional components must be provided. First the concept of scenario (defined as a derived/cloned portion of the Digital Twin on which changes can be applied) and tools for its creation, change, simulation, KPI computation, computing predictions, etc., have to be accessible. From applicative perspective, the what-if analysis (light green part in Figure 1) is more adequate on short-range action and particularly in operation to react to critical conditions and/or preventing incipient occurrence of damages, evaluating few possible short-term scenarios and quickly take a decision.
The scenario model and tools are capable of creating a scenario by extracting data from the Digital Twin in operation and introducing alterations (in Snap4City the digital twin representation is maintained into the KB, a graph database modelling symbolic representations and realizing an index for the managed big data). The changes may include, for example, changes to the road network (e.g., closing a road, changing the road directions or the speed limits, creating new roads, defining turn restrictions), the introduction or removal of bus stops and public transport lines, creation of novel attraction points or residential districts, etc. To observe and measure the impacts of the introduced changes, the analytics simulations need to be exploited, this time using as input one or more Digital Twin scenarios, in short, the Scenarios, altered with respect to the one in operation. In this case, it is possible to make use of predictions to carry out what-if analysis in future time windows. These functionalities are highlighted in Figure 1 with solid and dashed green arrows, respectively, and enclosed in the light green pane. It is worth noticing that, for each case study carried out by a user, multiple Scenarios, encompassing different areas of the city or devoted to different kinds of analysis, and a large range of multiple versions of the same Scenario should be created, more or less temporary. Such a functionality requires to define appropriate mechanisms to save and load each scenario with all its data, that should be modelled and stored independently from the Digital Twin in operation, since each scenario is an alternative instance, usually with well-defined geographical and temporal validity and a separated set of data which are describing the context.
Please note that the idea of having a brand-new full copy of the Digital Twin in operation with applied changes is not viable, being too expensive in storage and computation. Thus, different modelling strategies have been devised and described in the following.
The formal modelling of Scenarios, and the corresponding execution of analytic processes (for computing prediction, simulation, with classic tools as well as AI supported), may be used to perform automatic or semi-automatic optimizations. This implies generating changes and producing Optimized Scenarios taking into account some specific KPIs. In this context, it can be needed to exploit multimodal simulation capabilities of the digital twin (traffic, people flow, energy, etc.). The Optimized Scenarios have the same data model of the Scenario while they present/propose changes from the computation, for example, changes in the road graph, changes in the road parameters, etc. The production of Optimized Scenarios implies to propose/suggest changes to Decision Makers via a suitable interactive user interface (human in the loop [25]). The approach of generating optimized suggestions goes beyond the what-if analysis, that is typically limited to work on manually identified cases/scenarios. Suggestion generation by optimization (dark green part in Figure 1) is designed for activities performed in tactic and strategic planning at medium and long range.
For example, the Optimization of a Scenario could be used to automatically find a set of changes/configurations to reduce the average travel times in the city by modifying the road graph and/or the traffic light synchronization of the Scenario. This paradigm provides the decision-makers with a range of possible new modified scenarios among which they may select the best according to the obtained results, KPIs, and explainable AI (XAI) [26]. Therefore, after an initial scenario definition (which may or may not be the Scenario in operation), the optimization/simulation modules carry out the needed computations. Differently from the previous monitoring and what-if analysis cases, the results and KPIs are reported back to the optimization module to produce new changes in the scenario (thus creating novel scenario versions) using generative AI, reinforced learning, or a set of predefined moves in order to identify the solutions that minimize/maximize some KPI-based metrics. Such operations are schematized in Figure 1 with dark-green arrows.
In both cases (what-if and optimization), humans are kept in the loop. In monitoring and what-if cases, the decision makers have to perform most of the actions required: carefully observe and assess the city status, define scenarios, call the required computations, wait for the results, and repeat this cycle until a satisfactory solution is found [27]. This can undoubtedly help the decision-makers in carrying out their work, and a relevant investment in time and resources is still required. On the other hand, by using automatic optimization, after having defined the scenario, the goal (i.e., the criteria formalized as KPI to be minimized or maximized), and possibly some constraints, the approach would be able to autonomously produce a viable solution. This introduces two main benefits: first, most of the tedious work are delegated to the platform, leaving the human the responsibility to accept the proposed option. Secondly, the system can explore an extremely wider solution space with the consequent possibility to find solutions not considered by the human operator, via What-If. In addition, the operators could identify in the solution proposed by the optimizer some changes which could be not acceptable for logistic and normative problems. This could be an occasion to change the digital twin model adding more details about the possible changes which can be performed by the optimizer.
According to the above description, a web-based Scenario Editor has been integrated into the Snap4City platform to support the user in the manual creation of the scenarios to perform what-if analysis or call the execution of optimization processes, and to see the resulting proposed scenarios. In Figure 2, as an example, the scenario editor is shown. As can be seen, the main portion of the dashboard is occupied by the map on which the user can draw the area of interest and load all the required data (from Digital Twin in Operation, and from any other instances of the Scenarios) using the selector menu on the left. Each element shown is interactive and can be clicked to access additional information that can be changed by the user. Please note that each Scenario is managed as an Entity Instance which can evolve over time creating several versions, which can be singularly evolved and saved-as a new. Similarly, panels on the map are used to modify the road network, to set the scenario metadata, and to call save/load operations. Finally, panels on the right are used to invoke analytics. For example, for optimization or direct simulation in the what-if case passing a specific scenario as input, and for the creation of custom solutions from developers.
Read all from:
- P. Bellini, E. Collini, M. Fanfani, L. A. Ipsaro Palesi, P. Nesi, Smart City Digital Twin Platform Architecture for Mobility and Transport Decision Support Systems, 2024 IEEE International Conference on Big Data workshop: DSpaCES 2024. https://ieeexplore.ieee.org/iel8/10824975/10824942/10825075.pdf