
Welcome to the Varna on Snap4City.
Varna, Bulgaria's maritime capital, is located on the Black Sea coast and is renowned for its rich cultural heritage and vibrant summer tourism. Key attractions include the Varna Sea Garden, Roman Baths, and the Archaeological Museum, which houses the world's oldest processed gold treasure. The area also features a wealth of historic churches, and vibrant festivals that highlight local crafts, books, and other cultural activities. Restaurants, cafés, and markets add to the lively atmosphere, although they can contribute to congestion, especially when combined with the large crowds attending public events at nearby venues like the Festival Complex.
The city faces challenges related to the impact of high tourist volumes on its historical sites and urban environment, and aims to monitor and manage tourism flows, developing strategies to balance the city's dynamic tourism industry with the preservation of its cultural and historical assets.
The following dashboards are available.
|
|
 |
 |
|
The main functionalities of the main dashboard are:
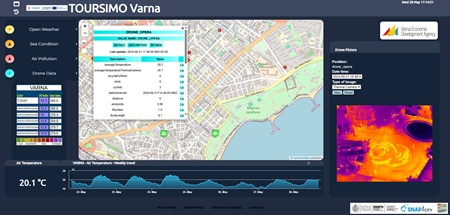
- A selector on the left that allows to activate/deactivate the visualization of data on the map. The popup on the sensor is responsible for controlling the visualization on the time-trend under the map. “Documentation” button links to this webpage.
- The map representing the geographic area
- The widget on the bottom part, below the map, with a single content showing the last value of a selected data, and a time trend widget representing the temporal data in a particular time period.
- Also a specific widget showing the UV Index and Ozone column forecast data is on the right of the dashboard.
The selector allows to shown/hide the following data represented as pins on the Map or activating specific advanced functionalities:
- Open Weathers: activate/deactivate the pins on the map representing the geographical position of the open weather sensors measuring weather data. By clicking the pin on the map a pop up is shown representing all the data measured by the sensor (i.e. air temperature, air pressure, air humidity, etc.).
- For each of the variable shown in the pop up in the column “Description”, it is possible to click on specific buttons (Last value, last 4 hours, last 24 hours, last 7 days, last 30 days, etc.) to see respectively the last value and the historical data represented in the widgets below the map.
- Sea Conditions: activate/deactivate the pins on the map representing the geographical position of the open weather data representing sea conditions. By clicking the pin on the map a pop up is shown representing all the data measured (i.e. wave direction, wave height, wind wave direction and height, etc.).
- For each of the variable shown in the pop up in the column “Description”, it is possible to click on specific buttons (Last value, last 4 hours, last 24 hours, last 7 days, last 30 days, etc.) to see respectively the last value and the historical data represented in the widgets below the map.
- Air pollution: activate/deactivate the pins on the map representing the geographical position of the open weather sensors measuring air pollution. By clicking the pin on the map a pop up is shown representing all the data measured by the sensor (i.e. CO, PM10, PM2.5, NO, NO2, etc.).
- For each of the variable shown on the pop up in the column “Description”, it is possible to click on specific buttons (Last value, last 4 hours, last 24 hours, last 7 days, last 30 days, etc.) to see respectively the last value and the historical data represented in the widgets below the map.
- UV Index forecasts: showing data regarding UV index of the day and the forecast for the next days.
- Drone Data: data captured by drones across various locations of interest. By selecting a specific location, it is possible to view the drone image on the right side, corresponding to a given date and in different modes: RGB, SP, or thermal camera. These modes allow visualization in normal view, infrared, or thermal imaging, respectively.
The webpage TOURISMO Varna – Sentiment Analysis provides a summary, generated by a Large Language Model (LLM), of the results obtained from the analysis of user satisfaction based on a questionnaire. The responses were collected through the Engaging City Users service, accessed via QR Code, as part of the TOURISMO project (https://www.snap4city.org/1081).
The TOURISMO Varna – Forecasting dashboard provides an automated approach for configuring and visualizing forecasts related to different measures. The left side allows the selection of the available devices for which predictions can be generated, while the right side is dedicated to the configuration of the forecasting parameters.
When a device is selected from the map, the configuration form is automatically updated to reflect the chosen device. The metric to be forecasted can then be selected, together with the forecasting model, either LSTM or Prophet. The Prophet model is recommended for sustainability reasons, as it can adapt to the observed data trend without requiring retraining. The configuration also includes the definition of the start date, which specifies the temporal starting point of the forecast, the prediction rate, expressed in minutes and representing the temporal resolution of each forecast step, and the slot number, which defines the total number of forecast steps to be generated from the selected start date.
After all required parameters have been configured, the computation is initiated by pressing the Submit button. Once the process is completed, the trend chart displayed below the map displays both the historical data of the selected metric and the corresponding forecast produced by the selected model. To use the forecasting tool, users must access the platform using a Snap4City account.
Additional information on
- TOURISMO Webpage on Snap4City
- Project web site: https://tourismo.interreg-euro-med.eu
- https://www.facebook.com/profile.php?id=61557381137979
- https://www.linkedin.com/company/tourismoproject/
Project kind: Interreg Euro-MED, cofounded by the European Union
Error: __clone method called on non-object in og_user_access_entity() (line 2249 of /var/www/html/drupal/sites/default/modules/og/og.module).