A systematic transition toward more sustainable transport solutions, included among the Sustainable Development Goals of the United Nations, is one of the main challenge modern cities must face. Increasing the usage of public transport and alternative mobility, like sharing services and micro-mobility, has been indicated as the most promising strategy since it can provide wide accessibility, reduce traffic congestion and consequently contain environmental impacts. Nevertheless, the citizen behavior shift toward such solutions in place of private motor mobility is hampered by several factors, among which quality of service emerge as one of the most relevant. To support decision makers in what-if analysis, tactical and strategic planning for improving of transport services, we present MODOM (MObility Demand-Offer Matching), a lightweight agent-based simulator that takes into account public transportation offer and sharing/micromobility solutions to evaluate the match with respect to the city users’ demand. MODOM supports dynamic updates of people’s travel plans to react to specific conditions and produces rich, decision-grade KPIs. The simulator runs city-scale scenarios in few minutes, avoids time-consuming configurations, and is integrated
with a Smart City Digital Twin for rapid what-if analysis, Snap4City. When needed for tactical planning, measured traffic can be injected by altering public transport timetables. Several experiments demonstrate that MODOM solves current simulator shortcomings and provides detailed simulation results to support decision-making processes.
"Data-Driven Mobility Demand-versus-Offer Matching by Dynamic Integration of Public and Sharing Services", IEEE Access, 2026. https://ieeexplore.ieee.org/do
The paper addresses a practical planning problem: cities need to shift mobility from private cars to public transport, sharing services and micro-mobility, but decision makers often lack fast, privacy-preserving tools for evaluating whether the available transport offer can satisfy actual mobility demand. Traditional agent-based mobility simulators can be detailed, but they commonly require heavy calibration, trajectory map-matching, traffic-flow reconstruction and long execution times.
|
MODOM in one sentence. |
Main contributions • Minimal setup: GTFS, road graph, origin-destination demand, sharing-service data and a few mobility parameters. • Simplified ABM: public-transport vehicles are active agents; travelers, stops and sharing vehicles are passive stateful entities. • Dynamic local plan adaptation without repeated global re-routing. • Integrated sharing and private micro-mobility through propensity and waiting-time “aging” mechanisms. • Traffic injection and a routing-based map-matching method for tactical scenarios. |
Figure 1 shows MODOM as a digital-twin loop: scenario definition draws data from transport offer, demand, road graph and population statistics; the simulation generates vehicle, stop, traveler and sharing-vehicle tracks; KPI computation closes the loop for what-if versioning and comparison.
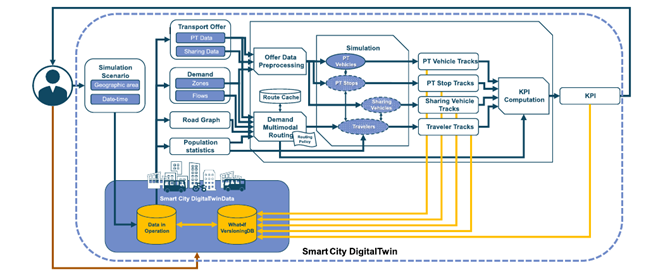
Figure 1. MODOM architecture integrated with the Snap4City Smart City Digital Twin: data ingestion, routing, simulation tracks and KPI feedback.
2. MODOM method: scalable agent-based simulation
MODOM reduces computational complexity by modeling only public-transport vehicles - buses, trams and trains - as active agents. A traveler is still stateful, but passive: the person can be walking, waiting at a stop, traveling on a vehicle, or using a private/shared micro-mobility vehicle. This design keeps the number of active agents close to the number of vehicles rather than the number of travelers.
|
Travelers, zones and routing • Demand is expressed by origin-destination matrices and mapped to small zones. • Each traveler has a multi-leg plan with walking and PT legs. • At runtime, a traveler may board any suitable vehicle that reaches the next destination zone, so overcrowding or a better arriving service can be handled locally. • A route cache avoids re-computing equivalent travel plans across simulations. |
Sharing and micro-mobility • Private bikes/scooters are modeled as optional traveler attributes that increase travel speed. • Shared bikes/scooters are available by zone and can be selected dynamically. • A propensity function, combined with a waiting-time aging factor, models the increasing willingness to switch from PT to a shared vehicle. • Sharing can replace a walking leg or, when convenient, the remaining trip. |
Traffic and map-matching
In standard operation, MODOM uses GTFS stop times directly and avoids moving vehicles over every road segment, eliminating a major source of error and configuration effort. When measured traffic needs to be injected for tactical planning, PT timetables are altered using speed data; this requires map-matching GTFS trajectories. The paper therefore proposes a routing-based algorithm and combines it with Valhalla to obtain reliable trajectories for all 290 tested routes.
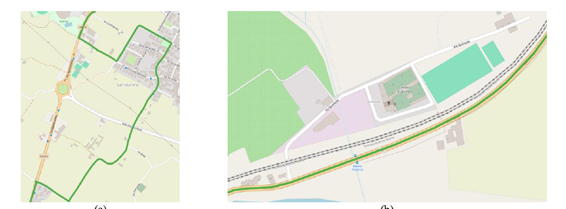
Figure 2. Proposed map-matching results on trajectories that caused errors in other approaches; the corrected paths better follow the GTFS trajectory.
|
Map-matching comparison |
SUMO-100 |
Proposed |
VAL-50 + Proposed |
|
Mapped trajectories |
290 |
290 |
290 |
|
DTW median (m) |
26,440.69 |
5,903.45 |
11,169.61 |
|
Frechet median (m) |
226.94 |
61.63 |
53.35 |
|
Hausdorff median (m) |
90.74 |
40.33 |
34.73 |
Interpretation: the proposed method maps every trajectory and greatly reduces trajectory-distance errors compared with SUMO-100, while the combined VAL-50 + Proposed strategy gives the best compromise on Frechet/Hausdorff distances.
3. Experimental case study and validation
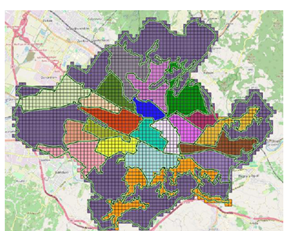
The experimental scenario is Florence, Italy, using real public-transport offer and demand data. PT services come from Tuscany Region GTFS files; sharing-service parking locations are added where available; demand is derived from mobile-operator origin-destination matrices and people-presence information. The authors resample the demand from coarse census areas to a 200 x 200 m grid, obtaining 228 fine-grained OD matrices in 5-minute steps and 121,862 daily movements.
|
Input data and scenario construction • Time span covers a full working day of PT operation, with demand concentrated in relevant service windows. • Road graph and routes support multimodal travel planning. • Short trips under 500 m and non-PT-oriented demand are filtered or reweighted to focus on demand that can realistically use PT and alternatives. • The same scenario can be modified for what-if experiments: capacities, lines, sharing stations, propensities and traffic conditions. |
Figure 3. Florence scenario: 200 x 200 m grid over census areas used to refine OD demand. |
Validation against SUMO
The paper compares MODOM with SUMO-based simulations. A key finding is that incorrect map-matching in SUMO-100 changes simulated vehicle paths and therefore affects occupancy and unmet-demand results. MODOM, which normally does not require road-level PT trajectory execution, matches the behavior of SUMO-OSM more closely when correct OSM trajectories are available.
|
Validation indicator |
MODOM vs SUMO-100 |
MODOM vs SUMO-OSM |
Reading |
|
Difference in unmet demand |
114 |
20 |
Lower is better |
|
Mean occupancy difference |
1.36 |
1.19 |
Lower is better |
|
Mean Euclidean distance of occupancy sequence |
11.2182 |
9.3248 |
Lower is better |
|
Mean cosine similarity of occupancy sequence |
0.9232 |
0.9442 |
Higher is better |
|
Mean Pearson correlation of occupancy sequence |
0.8714 |
0.9064 |
Higher is better |
Why this matters for planning
The validation demonstrates that simulation quality depends not only on the behavioral model but also on the fidelity of the public-transport offer. By avoiding map-matching when it is unnecessary, and improving it when traffic injection is required, MODOM reduces setup risk and supports repeated experiments needed for strategic and tactical planning.
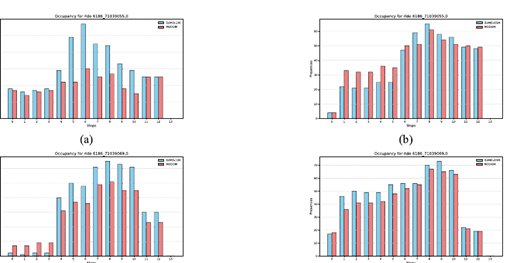
Figure 4. Vehicle-occupancy validation: MODOM aligns more closely with SUMO-OSM than with SUMO-100 when SUMO-100 suffers from trajectory errors.
4. What-if analysis, KPIs and conclusions
The what-if experiments change bus capacity, include trams and trains, add shared and private micro-mobility, vary user propensity to adopt sharing, redistribute sharing stations and inject measured traffic. MODOM reports both global and granular KPIs: unmet demand, missed boardings due to full vehicles, travel-time ratio, ride/walk/wait times, public-transport legs, sharing rides, private micro-mobility usage, stop crowding and vehicle occupancy.
|
Experiment |
Main change |
Unmet demand |
Misses |
Avg wait (s) |
Main interpretation |
|
E0 |
Full bus service, cap. 85 |
35 |
278 |
428.55 |
Baseline nearly satisfies demand |
|
E1 |
Bus capacity limited to 35 |
9,832 |
350,805 |
1,251.56 |
Capacity shortage produces severe unmet demand |
|
E2 |
+ trams and trains |
1,215 |
85,968 |
734.91 |
Multimodal PT reduces pressure on buses |
|
E3 |
+ sharing / micro-mobility |
1,082 |
77,374 |
717.48 |
Alternatives help, especially for walking legs |
|
E6 |
Higher sharing propensity |
927 |
68,027 |
675.78 |
Greater adoption improves service match |
|
E9 |
Traffic injection |
1,177 |
77,417 |
861.28 |
Traffic scenarios reveal tactical impacts |
Decision-making implications
|
• Buses remain the backbone of the offer; reducing vehicle capacity sharply worsens all KPIs. • Trams and trains substantially improve service matching, but local stop conditions still matter. • Sharing and micro-mobility are useful complements only when vehicles are well distributed and users are willing to adopt them. • Occupancy and stop-level boarding/alighting tracks reveal where to add frequency, relocate stops or re-balance sharing stations. |
Scalability result. |
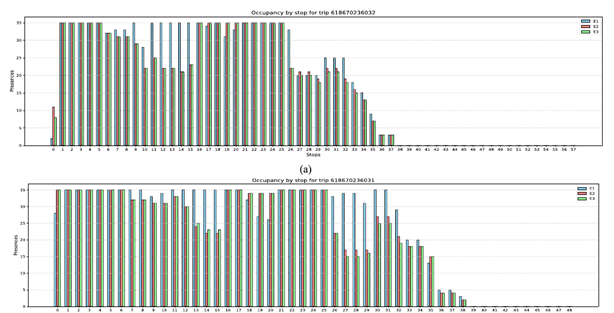
Figure 5. Vehicle occupancy by stop for two high-use trips: adding trams/trains and sharing/micro-mobility can reduce full-vehicle conditions in selected segments.
Bottom line
MODOM offers a practical middle ground between detailed but expensive ABM simulators and fast analytical methods: it preserves enough behavioral detail to compute actionable KPIs while keeping setup and execution light enough for iterative what-if analysis inside a smart-city digital twin.