Climate change is a challenge of global relevance that requires in-depth understanding and immediate response. Urban CO₂ emissions are one of the main causes of climate change, and their estimation is crucial for planning actions aimed at creating more sustainable cities. Currently, models for estimating CO₂ emissions mainly focus on traffic patterns, energy consumption, or a limited set of socio-economic factors, often overlooking the increasing role of urban services in today’s cities. Moreover, these data are rarely accessible, which limits their usefulness for policy design. In the present paper, a general CO₂ emission estimation approach, based on a large range of often accessible open data as predictors, is presented. Such open data are related to human activity regarding services and (socio-economic) conditions arising in a given (urban) area. The proposed model focuses on fine-scale prediction to better understand the dynamics of emissions via machine learning approaches, while taking into account an innovative study based on open data sources including city services. The resulting best models have been based on XgBoost and GCN (graph convolutional network). The outcomes provided better precision (MAPE in the order of 8%) with respect to the state-of-the-art solutions. The goal has been to understand how specific predictors can contribute to or mitigate CO₂ emissions in the observed area. To this end, the impact of several features has been analyzed in order to identify the related key factors influencing emissions. A formal study has been conducted to perform feature relevance analysis by using eXplainable AI (XAI) approach. The proposed model is useful to define targeted policies reducing the pollutant impact of cities, promote a more ecologically sustainable urban lifestyle and improve sustainable urban planning. Both solutions and models have been assessed and improved, so as to be more flexible by using some transfer learning techniques. This research and its related results have been produced and validated by exploiting the Snap4City framework for smart city, mobility and transport and data analytics on CN MOST, national center on sustainable mobility. In particular, such results deal with the metropolitan cities of Florence and Bologna.
"Exploiting Open Data for CO₂ Estimation via Artificial Intelligence and eXplainable AI", Expert Systems With Applications, Elsevier, ESWA, 2025 https://doi.org/10.1016/j.eswa.2025.128598
1. Introduction
Climate change is a challenge of global relevance that requires in-depth understanding and immediate response. In recent years, it has received increasing attention by both researchers and the scientific community: extensive research has been carried out to assess the impact of climate change on natural systems and human societies. One of the areas that has emerged from research is related to the contribution of urban areas to global greenhouse gas emissions. Urban areas have become responsible for approximately 70-75% of total global greenhouse gas emissions (Satterthwaite, 2008), (Stern, 2008). This figure underlines the significant role of human activities in urban areas in exacerbating the greenhouse effect and any climate instability. High population density, a wide range of industrial and commercial activities, intense energy demand are often the main aspects of cities. These factors contribute to the significant production of carbon dioxide (CO₂), methane (CH4), and other greenhouse gases, GHG. The resulting emissions stress the greenhouse effect, triggering global warming that causes devastating impacts, such as rising of average temperatures, changes in precipitation patterns, rising of sea levels, and altered ecosystems. In the past, numerous studies were conducted to analyze pollutant emissions in cities and their relationships with respect to various factors, such as vehicular traffic to monitor and reduce vehicular traffic congestion (Afrin & Yodo, 2020), (Bilotta & Nesi, 2021), (Bellini et al., 2022), its related emissions (Smit et al., 2010), (Bilotta & Nesi, 2022), as well as to study their spatial and temporal distribution (Yin Long et al., 2022).
Nevertheless, there has been a deeper study of the environmental parameters and how much they are influenced by urban structures and services in order to understand the reasons for those high values of pollutants and their diffusion and propagation (Badii et al., 2020), (Badii et al., 2020, Rennes). Strict policies and measures are needed to reduce GHG emissions in urban areas. This could involve the promotion of clean energy technologies, such as the use of renewable sources and the transition to low-emission transportation. In addition, energy efficiency in buildings, exploiting sustainable waste management practices, and the adoption of urban planning policies encouraging sustainable mobility can help to reduce emissions significantly.
In literature, some models for computing CO₂ on the basis of direct and indirect measures have been proposed. For example, the standard ISO 14064 also provides a model for computing GHG, greenhouse gas emissions (Wintergreen & Delaney, 2007). Direct measures should be focused on computing emissions on the basis of combustion measuring from houses, industries, moving cars, etc. Direct measures are in most cases unfeasible. For example, estimating the emission of each single car and truck would be unfeasible. On such grounds, indirect measures are used for computing emissions on the basis of traffic, amount of burned gasoline/gas in a certain area, etc. The standard helps cities and industries in computing their emissions. In most countries, industries are also requested to declare their emissions with detailed reports, either monthly or annually, to be provided to the authorities. Urban CO₂ emissions are one of the main causes of climate change, and their estimation is crucial for planning actions aimed at creating more sustainable cities. Currently, models for estimating CO₂ emissions mainly focus on traffic patterns, energy consumption, or a limited set of socio-economic factors, often overlooking the increasing role of urban services in today’s cities. Moreover, these data are rarely accessible.
Moreover, as described in next subSection on related works, there are several proposed approaches for indirect measures and in certain sense kind of predictions about CO₂ estimation on the basis of a number of local datasets related to specific countries or cities, such as energy consumption, traffic conditions, etc. In most cases, these models are exploited, when data collection according to standards is not viable or accessible, and models can be used as predictors to understand any infrastructural reasons for emissions.
The objective of this work is the prediction of CO₂ emissions as indirect measures starting from open data related to human activities and urban services in a city area. To this end, several relevant features have been analyzed in order to identify the key factors influencing emissions. Furthermore, through eXplainable Artificial Intelligence, XAI, techniques, we highlighted the relation between CO₂ emissions and city services and facilities located in various parts of the city area. To this end, we had to provide a formal partitioning of urban space in subareas or places where certain data can be considered to assess a wide range of issues covering virtually all aspects related to urban life. Once the predictive model has been developed for a reference metro city, its applicability and effectiveness in another metro city has been evaluated through a transfer learning. This has implied to assess the ability of the trained model on a specific city to be successfully used to estimate CO₂ emissions within different urban settings, while having access to similar data in input.
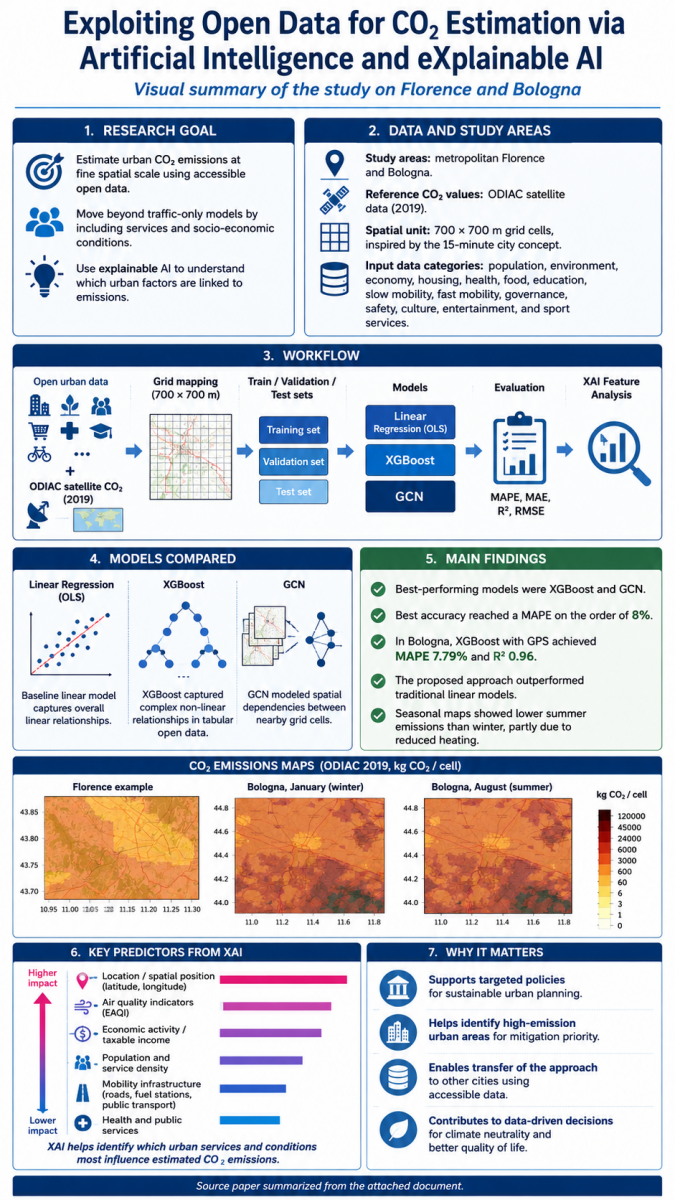
- A general model for estimating CO₂ emissions from open data is proposed, leveraging open urban data mapped onto a regular city grid.
- The model is validated by using high-resolution satellite CO₂ data (ODIAC) in two metropolitan areas: Bologna and Florence.
- A comparison of machine learning algorithms is carried out, identifying XGBoost as the most effective approach in terms of (Root Mean Squared Error), and MAPE (Mean Average Percentage Error). The results have been compared with respect to the state of the art solutions on the basis of R-squared (R2).
- Explainable Artificial Intelligence (XAI) techniques are integrated to identify the most influential predictors, providing new insights for urban policy design.
- Transfer learning strategies are explored to assess the model's generalization capabilities across different urban contexts. Additionally, Graph Convolutional Networks (GCNs) are evaluated as an alternative to GPS-based data, enabling proximity-based modelling.
|
Contribution |
Why it matters |
|
Open-data CO₂ model |
Uses accessible city data such as services, mobility, economy, environment, housing, health, food, education, safety, culture, sport, and government indicators. |
|
Fine spatial resolution |
Maps both predictors and CO₂ reference values onto a 700 x 700 m grid, enabling local diagnosis rather than city-level averages. |
|
Machine learning comparison |
Benchmarks Linear Regression, OLS, XGBoost, and Graph Convolutional Networks, showing that tree-based models capture non-linear urban effects better. |
|
Explainable AI |
Uses SHAP analysis to highlight the strongest predictors, improving transparency and helping policy makers interpret model outputs. |
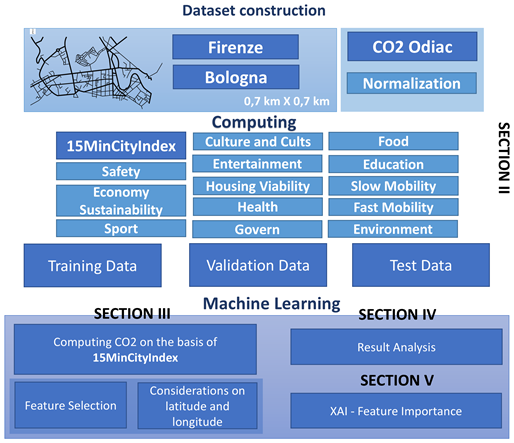
Figure 1. Study workflow: open-data collection, grid construction, ODIAC CO₂ reference data, model training/testing, and XAI analysis. Source: attached paper, Figure 1.
2. Data, features, and modelling strategy
All data are mapped to the same 700 x 700 m grid. Each grid cell represents a local urban context, and the input features summarize services or conditions in that area. The approach is therefore designed to connect emissions with the structure and intensity of city life.
Input data include GPS coordinates, inhabitants, air-quality indices, green areas, taxpayers and taxable income, economic value, housing cost per square meter, pharmacies and hospitals, food services, schools, bike racks, road length, government offices, fuel and charging stations, bus stops, sport centers, and other services depending on city availability. The common subset between Bologna and Florence is used to build an Adapted Data Table (ADT) for more transferable models.
Reference CO₂ and learning models
Reference emissions are taken from ODIAC satellite data, which provide monthly fossil-fuel CO₂ estimates. The authors aggregate the monthly maps into annual emissions and align them with the urban grid. This avoids relying on sparse urban sensors and enables complete spatial coverage of the metropolitan areas.
The paper compares classical linear models with XGBoost and GCN. XGBoost is well suited to heterogeneous tabular data and non-linear interactions. GCN is used to exploit spatial proximity by connecting grid cells through graph edges and weights derived from geographical distance.
Key test results
|
Case |
Best model |
RMSE |
MAPE |
R² |
|
Bologna |
XGBoost + GPS |
11.09 |
7.79% |
0.96 |
|
Florence |
XGBoost + GPS |
94.66 |
10.72% |
0.96 |
|
Merged ADT |
XGBoost + GPS |
42.96 |
10.23% |
- |
|
Bologna, no GPS |
XGBoost |
29.08 |
19.73% |
0.77 |
|
Florence, no GPS |
XGBoost |
176.41 |
26.97% |
0.87 |
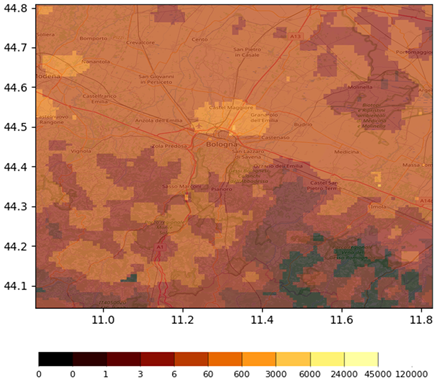
Figure 2. Example satellite-based CO₂ distribution for the metropolitan city of Bologna in January 2019. Source: attached paper, Figure 3.
Interpretation of the results: XGBoost with GPS coordinates is the strongest configuration in both cities. Linear Regression and OLS show acceptable R² values but much higher MAPE, indicating poorer local estimation quality. Removing GPS makes the models more general but reduces accuracy, showing that location captures important spatial structure not fully represented by the other open-data features.
3. Explainability, transferability, and policy value
The paper uses SHAP to interpret the best-performing XGBoost models. In the Bologna model with GPS, latitude and longitude are the strongest predictors, confirming that spatial location is highly informative. In the non-GPS model, the leading variables are cost per square meter, average taxable income, fuel stations, EAQI, taxpayers, and economic value; pharmacies, supermarkets, road length, inhabitants, government offices, sport centers, and health services also contribute but with smaller effects.
The SHAP analysis is important because it connects emissions with interpretable urban features. It does not merely forecast CO₂; it helps identify the types of services, economic indicators, and mobility-related infrastructures that most influence the estimates.
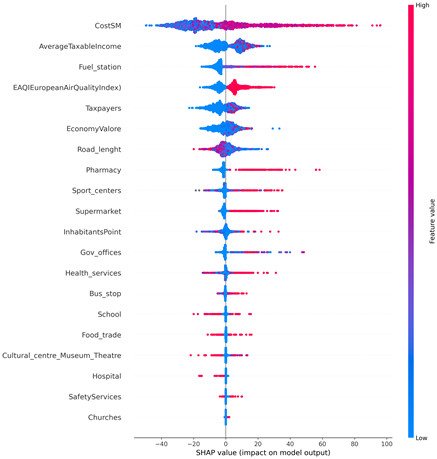
Figure 3. SHAP summary plot for the Bologna XGBoost model without GPS. Source: attached paper, Figure 8.
Transfer learning and generalization
To test flexibility, the authors build models using only features common to Bologna and Florence. This reduced ADT feature set slightly weakens city-specific performance, but the merged ADT XGBoost model with GPS reaches a MAPE of 10.23%, close to the individual city models. Directly training on one city and testing on the other is reported as unsatisfactory, which suggests that a shared multi-city training set is more effective than one-way transfer.
Overall assessment
The main finding is that open urban data, combined with satellite CO₂ references and modern machine learning, can produce accurate fine-scale estimates of emissions. XGBoost is the most robust solution in the reported experiments; GCN adds an explicit spatial-neighborhood mechanism, but it does not outperform XGBoost in the tested settings.
The policy value lies in moving from aggregate emission estimates toward local, explainable diagnostics. The method can help municipalities identify high-emission cells, understand which urban features are related to those emissions, and design targeted interventions such as improving sustainable mobility, balancing service distribution, reducing fuel-dependent accessibility patterns, or monitoring economically intensive areas. The approach is especially useful when direct CO₂ measurement is infeasible at full urban coverage.
Limitations to note
The source datasets differ between cities, which affects comparability. GPS improves performance but reduces portability. Satellite CO₂ data provide broad coverage but are not equivalent to dense ground measurements. Finally, the study uses 2019 data, so policy deployment would require updated open datasets and periodic revalidation.