The list of graphical widgets available in Snap4City to compose the user interface is accessible at the following link: https://www.snap4city.org/download/video/course/das/
The following Snap4City nodes for Node-RED to implement Proc.Logic/IoT App are created into the Node-RED and into the configuration the user has to indicate the dashboard in which they have to appear. As alternative the user may also create a new Dashboards directly from the IoT App, and this Dashboard to push the new widgets having a counterpart into the IoT App itself.
Most of the following nodes communicate with the Dashboards by means of WebSocket.
All the users accessing to the same Dashboard will produce data, events on the same IoT App, and the data provided by the same IoT App is going to send the data on all the users connected on the same Dashboard and will see the changes all together, all the same time. This is a Control Room approach, as singleton and collaborative work on it. For other interaction models see later Client-Side Business Logic.
Each node has some help directly accessible into the Node-RED editor with precise JSON details of input and outputs messages.
Each counterpart widget presents a menu item called MoreOptions in which several detailed configuration can be defined on how to show the data which are provided from the Proc.Logic. Please used it to better results.
Another summary of Dashboard Widgets is also provided in:
- TECHNICAL OVERVIEW: https://www.snap4city.org/download/video/Snap4City-PlatformOverview.pdf
NOT ALL Dashboard Widgets of Snap4City are Listed in this table, which presents ONLY THOSE which have a counterpart on Proc.Logic /IoT App Node-RED!
|
Node on Node-RED Snap4City |
name |
Description WIDGET |
|
|
Gauge |
Receive a JSON with one ServiceURI and/or value to be shown on gauge. You do not need to send data, only the ServiceURI, the data are automatically collected and updated by the Widget. You can dynamically change the ServiceURI. |
|
|
Speedometer |
Receive a JSON with one ServiceURI and/or value to be shown on speedometer. You do not need to send data, only the ServiceURI, the data are automatically collected and updated by the Widget. You can dynamically change the ServiceURI. |
|
|
BarSeries |
Receive a JSON with a set of ServiceURI and/or values to be shown on BarSeries. You do not need to send data, only the ServiceURI, the data are automatically collected and updated by the Widget. You can dynamically change the ServiceURI. |
|
|
Switch, on/off but. |
|
|
|
Knob, Dimer |
|
|
|
Button, Impulse button |
The widget on dashboard provides an impulse button and the user acting on it sends the event in the flow from the output PIN on this node. |
|
|
Keypad, Numeric Pad |
Numeric Keypad widget on dashboards which sends an event into the flow from the output Pin of this node regarding the value imposed. |
|
|
Device Table |
For details See: https://www.snap4city.org/809 |
|
|
dropdown |
A widget which presents a selector to the users on the basis of a configuration defined into the node and dynamically changed by sending a JSON in the input PIN of the node. The selection performed produces a message from the output PIN of this node in the flow. |
|
|
Dashboard Form |
A widget which presents a FORM to request data (integrate, on/off, date time, etc.) to the users on the basis of a configuration defined into the node and dynamically changed by sending a JSON in the input PIN of the node. The insert data produced by the users produce a message from the output PIN of this node in the flow. |
|
|
Single Content |
A widget which may receive and show on dashboard single data (integer, string, time, etc.) and also HTML with some CSS formats. |
|
|
External Content |
A widget for showing some HTML page on dashboard. The HTML page can be changed dynamically. |
|
|
Spidernet, Radar |
The node receives a JSON with a set of ServiceURI and/or values to be shown on Spidernet, Radar widget on Dashboard. |
|
|
Donut, Pie |
Receive a JSON with a set of ServiceURI and/or values to be shown on Donut, Pie widget on Dashboard |
|
|
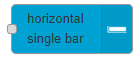
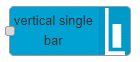
BarSeries |
Receive a JSON with a set of ServiceURI and/or value to be shown on BarSeries widget on Dashboard. The bars can be vertical, horizontal, staked non staked, etc. See MoreOptions on the Dashboards builder for changing the show modality. |
|
|
Table content |
Receive a JSON with a set of ServiceURI and/or values to be shown on table on Dashboard. The table can have colored cells according to colormap standard. it is less flexible of device table, but simpler to be used. |
|
|
Time Trend, Time Series |
Receive a JSON with one ServiceURI and/or value to be shown on Time Trend, Time Series widget on Dashboard |
|
|
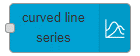
MultiSeries, Time Series, Curved Line, time compare |
Receive a JSON with a set of ServiceURI and/or values to be shown on MultiSeries, Time Series, Curved Line, time compare widget on Dashboard. The trends can be staked / non staked, shaded / non shaded, double axis, etc. See MoreOptions on the Dashboards builder for changing the show modality. |
|
|
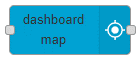
Multi Data Map (dashboard Map) |
See for details https://www.snap4city.org/774 |
|
|
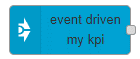
Event Driven MyKPI |
This node produces an event every time a given MyKPI changes its value. |
|
|
This node can be used to read an indicated Synoptical Variable See for details https://www.snap4city.org/644 |
|
|
|
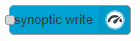
This node can be used to send and event to an indicated Synoptical Variable See for details https://www.snap4city.org/644 |
|
|
|
This node produces an event every time a given Synoptical Variable changes its value. See for details https://www.snap4city.org/644 |
|
|
|
D3 charts |
A widget which may send to the dashboard complex graphic representation according to the D3 Library. The widget allows to provide to the Dashboard the specific D3 graph you like, the data and the interaction configuration you would like to have on it according to the D3 standard Library. See for details https://www.snap4city.org/790 |
|
|
geolocator |
The widget on dashboard to get the GPS location of the Browser of the client hosting the dashboard and send it to the flow from the output PIN of the flow. |
|
|
Speak Synthesis |
The flow can send a text which is vocalized on the client side, for example to help the user on browser, or to harm him. The voice can be of different languages, male/female, etc. See for details https://www.snap4city.org/777 |
|
|
See Multi Data Map (dashboard Map) |
DEPRECATED |
|
|
See Multi Data Map (dashboard Map) |
DEPRECATED |
|
|
See BarSeries |
Almost DEPRECATED |
|
|
See BarSeries |
Almost DEPRECATED |
|
|
See D3 charts |
Almost DEPRECATED |