Snap4City Dashboard Builder enables users of any role in the platform to create and manipulate their Dashboards of any kind, passing from simple data visualization tools to business intelligence tools, to control room dashboards and interactive systems and synoptics, including full Digital Twin solutions with sophisticated integrated 3D representation at low cost. See details on dashboard from the training course part 2: https://www.snap4city.org/download/video/course/das/ [Industry4.0-2020], [Dashboards2019], [DashboardProduction2020], [ChemicalPlant2021].
Dashboard Builder allows the creation of Dashboards:
- Manual selection and composition of Widgets on Dashboards. With the Dashboard builder the developer can arrange the widget in the frame and may change some setting using the so called More Options of each Widget.
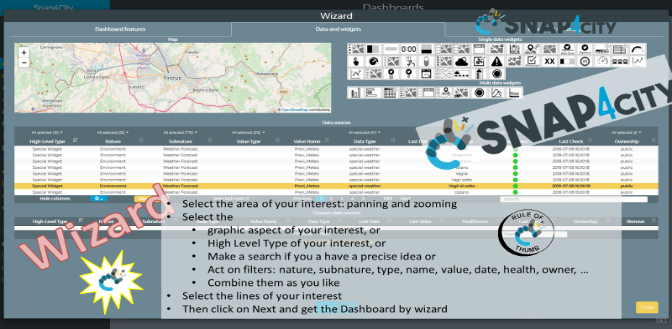
- automatically using the Dashboard Wizard to simplify the production and the connection of data to widgets according to models/templates. Once creates, they can be manually edited for defining and changing all detailed aspects. Dashboard Wizard is an expert system for immediate matching HLT data vs graphics representation for creating Dashboards by rendering and acting on data with a large range of graphics widgets.
- widgets may
- be used in editing mode with the More Options can be accessed by selecting it in the widget contextual menu that can be open by clicking on the ( ) icon on the top-right corner of the widget.
- More Options allows to customize widget in deep for: data source, size, colors, shape, font, strings UTF-8 also Arabic, dates, left/right time series, staked/non staked, by value / by type, comparison or not, text change, data order change, etc.
- have coded business intelligence.
- More Option may include CK Editor for embedding Client-Side Business Logic, only for authorized Area Managers. Please ask to your administrator.
- May be connected to Proc.Logic (Server-Side Business Logic) having a counterpart into the Node-RED editor, and even produced by the Proc.Logic when a Dashboard Node is placed declaring the Dashboard on which one would like to work with. This is the approach by which one Dashboard may request the activation of Data Analytics or other server-side complex data processing (in batch or event driven), for example.
- be Customized for creating new widgets and synoptics using visual tools and templates: for real time rendering data on graphical scenographic tools, and for graphic interaction on the systems from dashboard to actuators end-to-end secure connection.
- exploit External Service for integrating external tools via Processing Logic and/or via IFRAME into External Content Widget.
- be used in editing mode with the More Options can be accessed by selecting it in the widget contextual menu that can be open by clicking on the ( ) icon on the top-right corner of the widget.
- styling using a large set of styles, which can be customized and enlarged by following a simple tutorial. The passage from one style to another is immediate, and the default style can be chosen for each of your Dashboard.
- Creating/activating menu and connections among dashboards and other pages, or exploiting the organization menu on the upper left corner
- Connecting a Chat of the Dashboard for distributed Control Room and situation rooms discussion.
- Etc.