An Origin-Destination (OD) matrix can represent the flow of entities (people, vehicles, etc.) from a starting area to one or more destinations (named outflows) or vice versa (i.e., inflows).
Even if a single geo-localized point can be considered an origin or destination area, more typically, flows are grouped on the basis of zones, as for example Regions, Provinces, Municipalities, or finer geographical subdivisions such as census sections (e.g., the Aree di Censimento – ACE – defined by the ISTAT in Italy). Also, the Military Grid Reference System (MGRS) can be used to divide an area of interest into smaller sections.
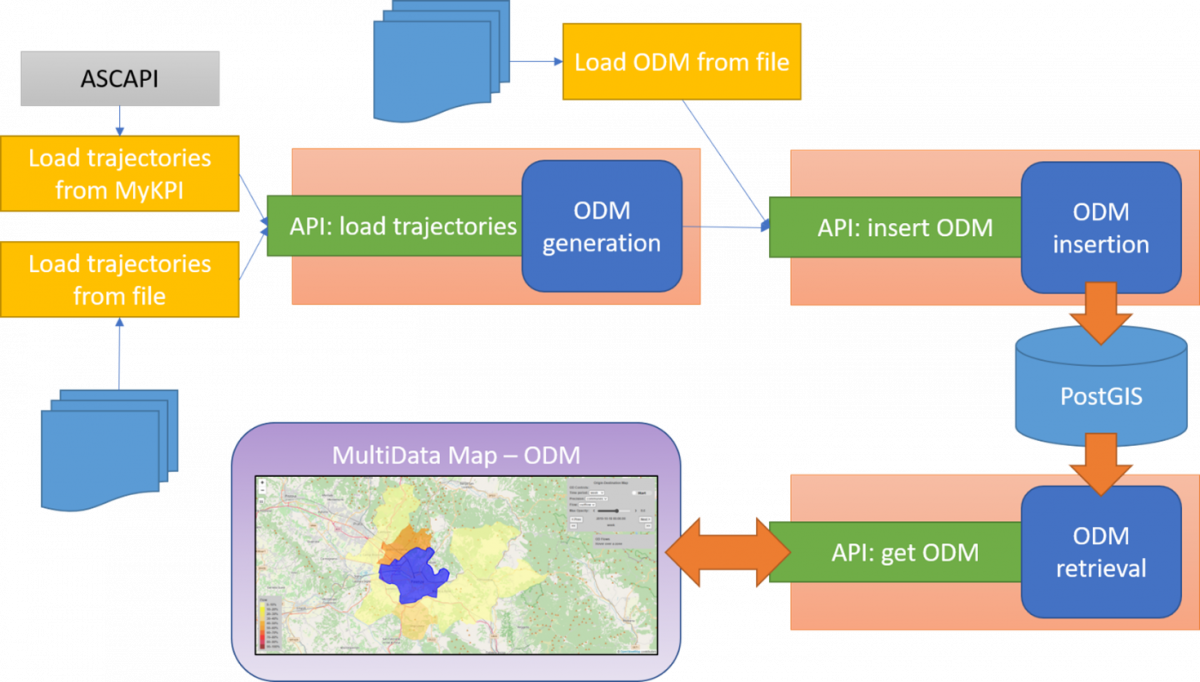
In the Snap4City platform, OD matrices are stored in a PostGIS database, that is a spatial database that extends the PostgreSQL object-relational database by adding support for geographic objects and allows location queries to be run in SQL. In this way, polygonal descriptions of the origin and destination areas can be associated with flow information and easily retrieved.
Such data can be inserted and retrieved using a set of REST Python APIs and presented on the Snap4City MultiData Map according to the following diagram:
The MultiData Map for OD representation is shown in the following figure

The MultiData Map is composed by two main entities: the actual map, and a Selector menu with which different kind of information can be loaded dynamically on user demand. Each field of the Selector can be configured with an URL that is used to generate specific event in order to load data into the map.
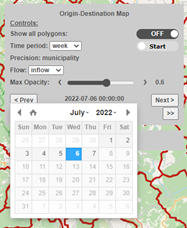
The OD map can be controlled using the control-panel:
- [switch] Show all polygon: if ON, all the polygonal shapes in the area are shown, according to the specified Precision
- [selector/switch] Time period: if the switch is set to ON, the map is animated by showing the different OD data for several days, according to the time span specified in the selector (accepted values are week and month)
- [label] Precision: show the kind of represented area used to show the OD flows
- [selector] Flow: inflow or outflow data can be showed according the value selected
- [slider] Max Opacity: used to choose the color opacity value used to draw the polygonal areas
- [button/data and time picker] Date/Time Control: the date and time of the OD data can be changed on daily steps using the [<Prev] and [Next>] buttons (if data are available) or using the [<<] and [>>] buttons to move by a wider time span (week or month). By clicking the date time text, a calendar is shown and the user can pick a specific date and time directly.
Under the control-panel, a data-panel is shown: here information about the flows for the selected area are reported. Alternatively, such information can be presented in a popup-panel over the selected area.
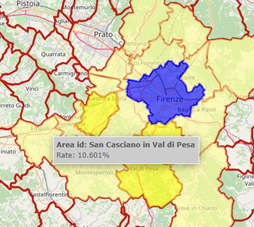
Finally, in the bottom-left corner of the map, a colormap is shown, indicating the color representing specific flow percentages. Such colors are used to fill the polygonal shapes according to their flow values.
Selector configuration and map parameters
In the case of OD matrix visualization, the URL to be used in the Selector must have the following syntax:
https://odmm.snap4city.org/api/get?<list_of_parameters>
Note that, in case of on-premise installations, the first part of the URL must be changed accordingly.
The <list_of_parametes> contains the following parameter:
- precision [mandatory] indicates the kind of polygonal shapes used to represents origin and destination areas. According to the data collected into the PostGIS, this value can be region, province, municipality, ace, section, communes, or mgrs;
- from_date [mandatory] indicate the starting date from which retrieve OD flows. It must be expressed as YYYY-mm-dd HH:MM:SS;
- organization [mandatory] the name/ID of the organization that own the OD data, as saved into the PostGIS;
- latitude [mandatory] together with longitude specify the point to select the initial source area;
- longitude [mandatory] together with latitude specify the point to select the initial source area;
- inflow [mandatory] if set to True, shows inflow data for the source area, if set to False, shows outflow data;
- od_id [mandatory] the ID of the OD matrix to be shown into the map;
- perc [optional, default=True] if set to True, shows the flow data in form of percentages, if set to False, absolute flow values are instead reported;
- color_map [optional, default=ODcolormap1] this parameter let the user specify the metric_name of the colormap to be used to represent the flows. Such metric_name must be present in the dashboarddb.heatmap.color database table of the used Snap4City installation;
- opacity [optional, default=0.6] percentage of initial opacity of the polygons on the map. Note that this value can be changed on user demand through the command panel;
- all_polygon [optional, default=False] if set to True, all the polygon shapes included into the area visualized on the map are shown, even if they do not have associated flow data, according to the precision parameter. If set to False, only the polygons relevant to show the flows are presented into the map;
- all_polygon_color [optional, default=#BF2015 (RGB: 191, 32, 21)] when all_polygon=True, this color is used to represent the border of the polygons. Color must be expressed in the HEX format;
- source_polygon_color [optional, default=#0000FF (RGB: 0, 0, 255)] inner color of the source polygon. Color must be expressed in the HEX format;
- panel_on_shape [optional, default=False] if True, the flow data appears over the associated polygon in a popup-panel, otherwise, if set to False, the flow data appears on the right side of the map in the data-panel under the control-panel;
- panel_bg_color [optional, default=#CCCCCC (RGB: 204, 204, 204)] background color for all the panels of the OD matrix interfaces (i.e. control panel and flow data panel). Color must be expressed in the HEX format;
- panel_font_color [optional, default=#505050 (RGB: 80, 80, 80)] color for the text included into all the panels. Color must be expressed in the HEX format;
- panel_width [optional, default=340px] used to set the width of the control-panel;
- panel_font_size [optional, default=12px] used to set the text font size shown in the control-panel;
- data_panel_width [optional, default=240] used to set the width of the data-panel under the control-panel;
- data_panel_font_size [optional, default=12px] used to set the text font size shown in the data-panel;
- popup_panel_width [optional, default=300] used to set the maximum width of the popup-panel that appear over the shape polygons;
- popup_panel_font_size [optional, default=12px] used to set the text font size shown in the popup-panel;
- cm_font_size [optional, default=12px] used to set the text font size shown in the colormap legend displayed in the bottom-left corner of the map;
- map_name [optional, default=Origin-Destination Map] used to set the title of the map, shown at the top of the control panel. Note that, in order to show spaces, the name must include underscores (e.g. to show Map Name, the parameter must be set to Map_Name);
- stat_id [optional, default=<empty string>] if specified with an OD ID, the related data can be used to show additional information passing through an IoT App (NodeRED). Indeed, the MultiData Map implement also a web socket that on-click event sends data to a specific IoT App exploiting the custom node coordinates-from-map. In addition to latitude and longitude information, in the case of OD matrices, additional data are sent to the IoT App:
- sourceID: source polygon ID;
- sourceName: text name of the source polygon;
- precision;
- from_date:
- organization;
- inflow;
- od_id;
- perc;
- stat_id;
- latitude:
- longitude
Such data can then be used to make additional request to the Python API in order to retrieve specific data to be shown using dedicated widget on a dashboard, typically the same dashboard where the MultiData Map is shown.
Representation of presences
The MultiData Map can be used also to represent presences in a specific area. In this case, when data are loaded into the PostGIS database, the source and target area must be set to the same area. Then, the map will show only a single shape on the map, reporting its presence data into the data-panel or popup-panel. Since shown data do not represent flows anymore, the Inflow/Outflow selector is removed from the control-panel, as well as the colormap for the same reason.
Other related resources