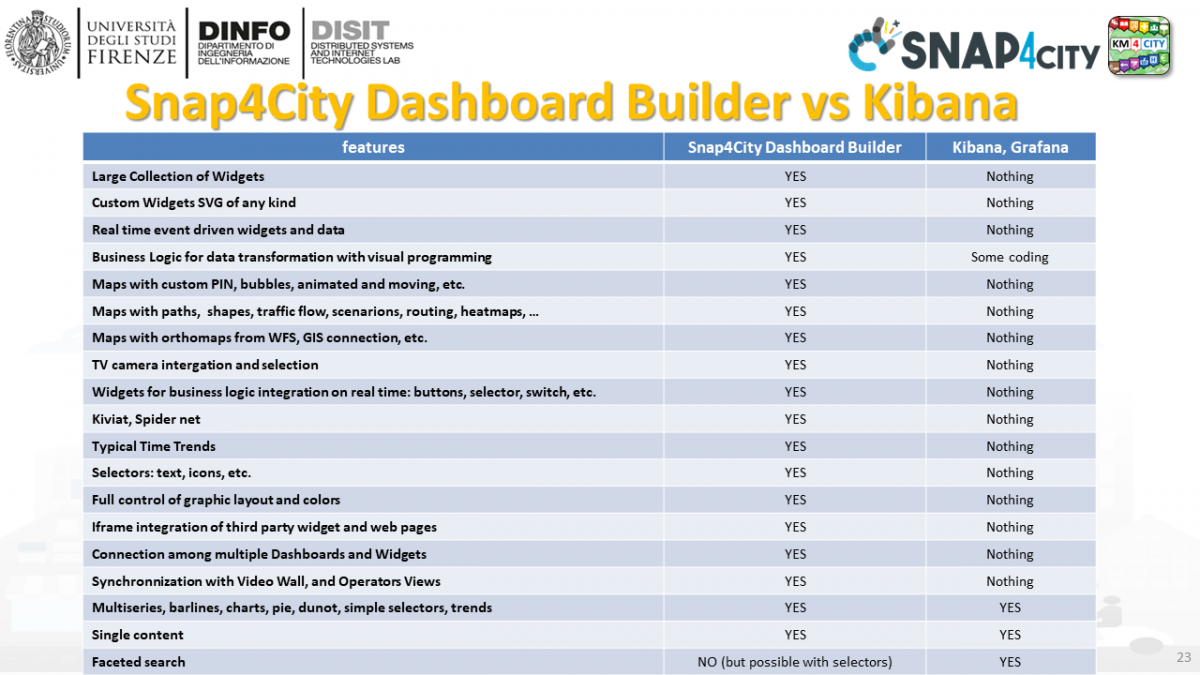
Snap4City has two main solutions for providing dashboards. They cover two different needs: (i) Dashboard Bulilder is a tool for creating decision maker dashboards, (ii) Kibana is more suitable for operators working on the data flows.
There are relevat differecences, while other details are reported in the table in the figure:
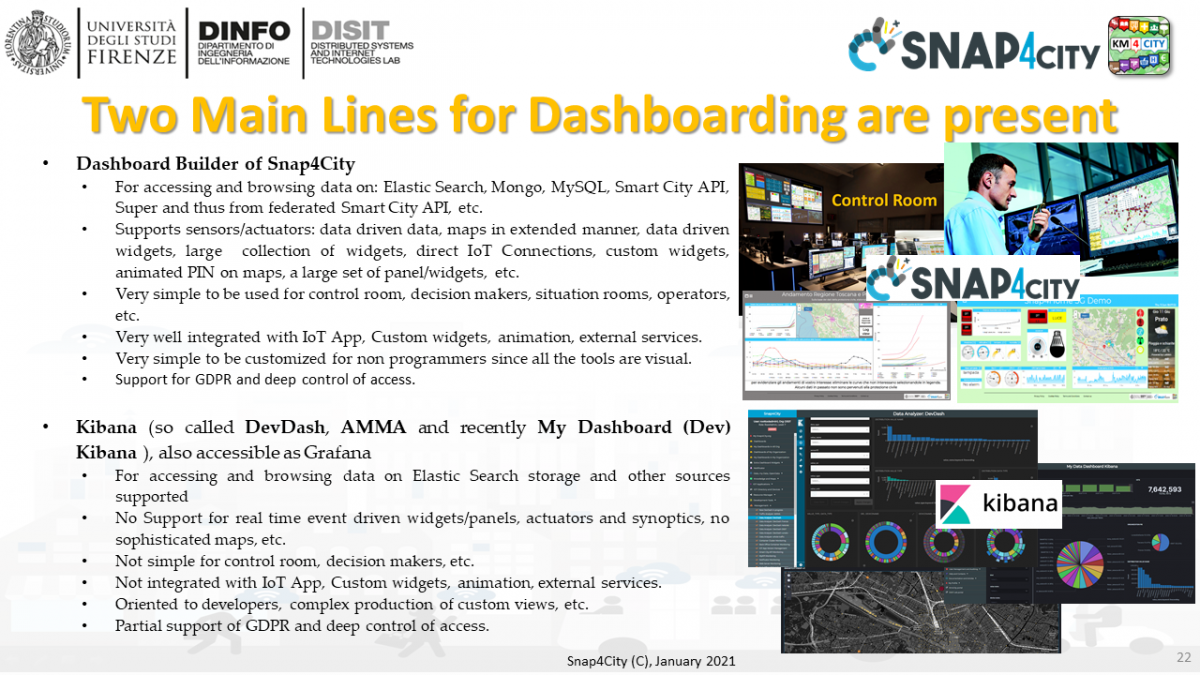
- Dashboard Builder of Snap4City
- ACCESS to example via some public dashboards
- For accessing and browsing data on: Elastic Search, Mongo, MySQL, Smart City API, Super and thus from federated Smart City API, etc.
- Supports sensors/actuators: data driven data, maps in extended manner, data driven widgets, large collection of widgets, direct IoT Connections, custom widgets, animated PIN on maps, a large set of panel/widgets, etc.
- Very simple to be used for control room, decision makers, situation rooms, operators, etc.
- Very well integrated with IoT App, Custom widgets, animation, external services.
- Very simple to be customized for non programmers since all the tools are visual.
- Support for GDPR and deep control of access.
- can integrate into a WIDGET also Kibana views
- Kibana (so called DevDash, AMMA and recently My Dashboard (Dev) Kibana ), also accessible as Grafana
- ACCESS to actual data ONLY of the data you can see in your Organization.
- For accessing and browsing data on Elastic Search storage and other sources supported
- No Support for real time event driven widgets/panels, actuators and synoptics, no sophisticated maps, etc.
- Not simple for control room, decision makers, etc.
- Not integrated with IoT App, Custom widgets, animation, external services.
- Oriented to developers, complex production of custom views, etc.
- Partial support of GDPR and deep control of access.