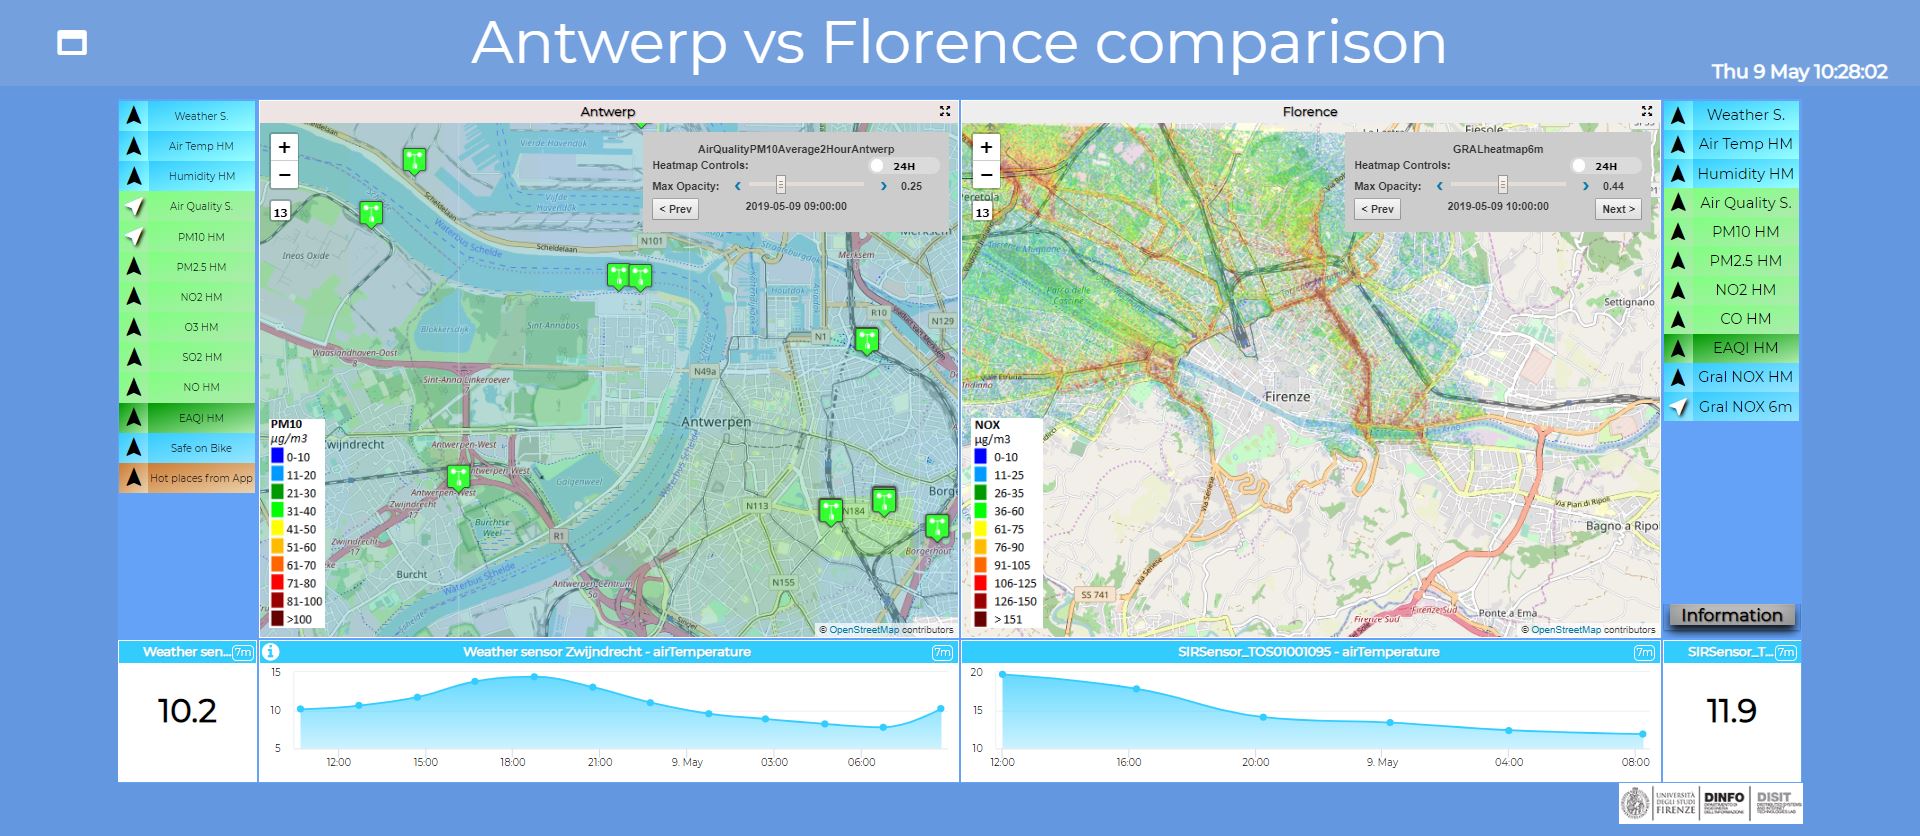
This dashboard called "Antwerp vs Florence Comparison" has been designed to provide an overview to the city officials or users about a comparison between the city of Antwerp and Florence. This dashboard allows to control in the same time data from the same kind of sensor in the city of Antwerp and in the city of Florence to have a complete view on other environmental parameters in the cities. The dashboad has been produced by Snap4City team, you can find more and more information on Https//www.snap4city.org
Dashboard Link: https://www.snap4city.org/dashboardSmartCity/view/index.php?iddasboard=MTc1Nw==
Please read https://www.snap4city.org/drupal/node/435 for the definitions of the measured and computed values.
On the left you can select to see on Antwerp map:
- Weather S.: PINs about the location of weather sensors (see below for what you can do on the pin for showing data, and drill down on the several data associated with sensors).
- Air Temp heatmap: real time heatmap of the air temperature in the Antwerp area. The map is upgraded every 2 hours.
- Humidity Heatmap: real time heatmap of the air humidity in the Antwerp area. The map is upgraded every 2 hours.
- Air Quality S.: PINs about the location of air quality sensors (see below for what you can do on the pin for showing data, and drill down on the several data associated with sensors).
- PM10 HM: real time heatmap of pollutant levels in air in terms of PM10 (measured in µg/m3) particles in the Antwerp area. The map is upgraded every 2 hours.
- PM2.5 HM: real time heatmap of pollutant levels in air in terms of PM2.5 (measured in µg/m3) particles in the Antwerp area. The map is upgraded every 2 hours.
- NO2 HM: real time heatmap of pollutant levels in air in terms of nitrogen dioxide (NO2 measured in µg/m3) in the Antwerp area. The map is upgraded every 2 hours.
- NO HM: real time heatmap of pollutant levels in air in terms of nitric oxide (NO measured in µg/m3) particles in the Antwerp area. The map is upgraded every 2 hours.
- SO2 HM: real time heatmap of pollutant levels in air in terms of sulphur dioxide (SO2 measured in µg/m3) particles in the Antwerp area. The map is upgraded every 2 hours.
- O3 HM: real time heatmap of pollutant levels in air in terms of ground-level ozone (O3 measured in µg/m3) in the Antwerp area. The map is upgraded every 2 hours .
- EAQI HM: real time heatmap of European Air Quality Index. The resulting index from 1 to 5 indicate the quality of air.
- Safe on Bike: heatmap representing the safety levels for bikes (7 levels from very bad to excellent) in the Central Antwerp area according to the positive or negative feelings of citizens. The map is static and related to the 2018.
- Hot places from App: heatmap representing the places in which the Snap4City mobile App has been most frequently clicked.
On the right you can select to see on Florence map:
- Weather S.: PINs about the location of weather sensors (see below for what you can do on the pin for showing data, and drill down on the several data associated with sensors).
- Air Temp HM: real time heatmap of the air temperature in the Florence area. The map is upgraded every 2 hours.
- Humidity HM: real time heatmap of the air humidity in the Florence area. The map is upgraded every 2 hours.
- Air Quality S.: PINs about the location of air quality sensors in Florence (see below for what you can do on the pin for showing data, and drill down on the several data associated with sensors).
- PM10 HM: real time heatmap of pollutant levels in air in terms of PM10 (measured in µg/m3) particles in the Florence area. The map is upgraded every 24 hours.
- PM2.5 HM: real time heatmap of pollutant levels in air in terms of PM2.5 (measured in µg/m3) particles in the Florence area. The map is upgraded every 24 hours.
- NO HM: real time heatmap of pollutant levels in air in terms of nitric oxide (NO measured in µg/m3) particles in the Florence area. The map is upgraded every 24 hours.
- CO HM: real time heatmap of pollutant levels in air in terms of carbon monoxide (CO measured in µg/m3) particles in the Florence area. The map is upgraded every 24 hours.
- EAQI: real time heatmap of European Air Quality Index. The resulting index from 1 to 5 indicate the quality of air. The map is upgraded every 24 hours.
- Gral NOX HM: heatmap of the sum of NO and NO2 particles hourly predictions in µg/m3 measured 3 meters on the ground and computed using Gral model. The predictions related to the entire 24 hours are available, clicking on the "Next" button on the Heatmap Controls widget you can see the forecast.
- Gral NOX (6m): heatmap of the sum of NO and NO2 particles hourly predictions in µg/m3 measured 6 meters on the ground and computed using Gral model. The predictions related to the entire 24 hours are available, clicking on the "Next" button on the Heatmap Controls widget you can see the forecast.
Below the Selectors on the left/right you can see:
- A single value referring to the real time air temperature in Antwerp of: Weather sensor Zwijndrecht
- A single value referring to the real time air temperature in Florence of: SIRSensor_TOS01001095
On the Maps, several information may appear:
- PINs about POI where you can select a PIN to see information
- Name
- Description
- Details (Location and Adress)
- PINs about sensors where you can select a PIN to see information
- Details
- Description
- Real Time data: clicking on one of the buttons under the heading "Buttons" (Last Value, Last 4 hours etc.) the trend below the map change in according to the selected sensor (the name of each measred sensors can be found under the heading "Description"). The heading "Value" indicates the realt time measuring for each sensors description (according to the last update).
- Heatmap Information pop up when you click on a point of the map
- Description (Date & Time, Metric Name, Heatmap Value, Coordinates)
- Value (please note that the value could have been produced by interpolation or prediction according to the model that you are observing)
- Heatmap Controls widget positioned at the top right of the map with the name of the Heatmap
- Opacity: the slider that can be used to correct the opacity of the map
- "Next" and "Prev": the buttons can be used to display maps related to different date and times
- Animation: the swich "24H" to make the animation of the heatmaps related to the previous 24 hours
- the legenda of the heatmap positioned at the bottom left of the map
Below the Antwerp Map:
- the initial single value is referring to air temperature of: Weather sensor Antwerp Zwijndrecht
- the initial trend value is referring to air temperature of: Weather sensor Antwerp Zwijndrecht
- both single value and trends are used to visualize the data selected on the map, see above
Below the Florence Map:
- the initial single value is referring to air temperature of: Weather sensor Florence SIRSensor_TOS01001095
- the initial trend value is referring to air temperature of: Weather sensor Florence SIRSensor_TOS01001095
- both single value and trends are used to visualize the data selected on the map, see above
The data of this dashboard have been collected by Snap4City according to the PCP lanched by Select4Cities project.
The data sources used for creating this dashboard are listed in the following web pages:
Helsinki: https://www.snap4city.org/drupal/node/364
Antwerp: https://www.snap4city.org/drupal/node/363
 European Commission Affiliation Select4Cities project has received funding from the European Union’s Horizon 2020 research and innovation programme under grant agreement No 688196. Please note that this website represents the view of Snap4City, with the support of Select4Cities project and that the Commission is not responsible for any use that may be made of the information it contains.