This dashboard aims at providing to the city users managing an Air Quality sensor a control panel to monitor their hosted sensor and at the same time to have a privileged view on all the other environmental parameters of the city. The dashboad has been produced by Snap4City team, you can find more and more information on Https//www.snap4city.org
Dashboard Link: https://www.snap4city.org/dashboardSmartCity/view/index.php?iddasboard=MTc0Mw==
Please read https://www.snap4city.org/drupal/node/435 for the definitions of the measured and computed values.
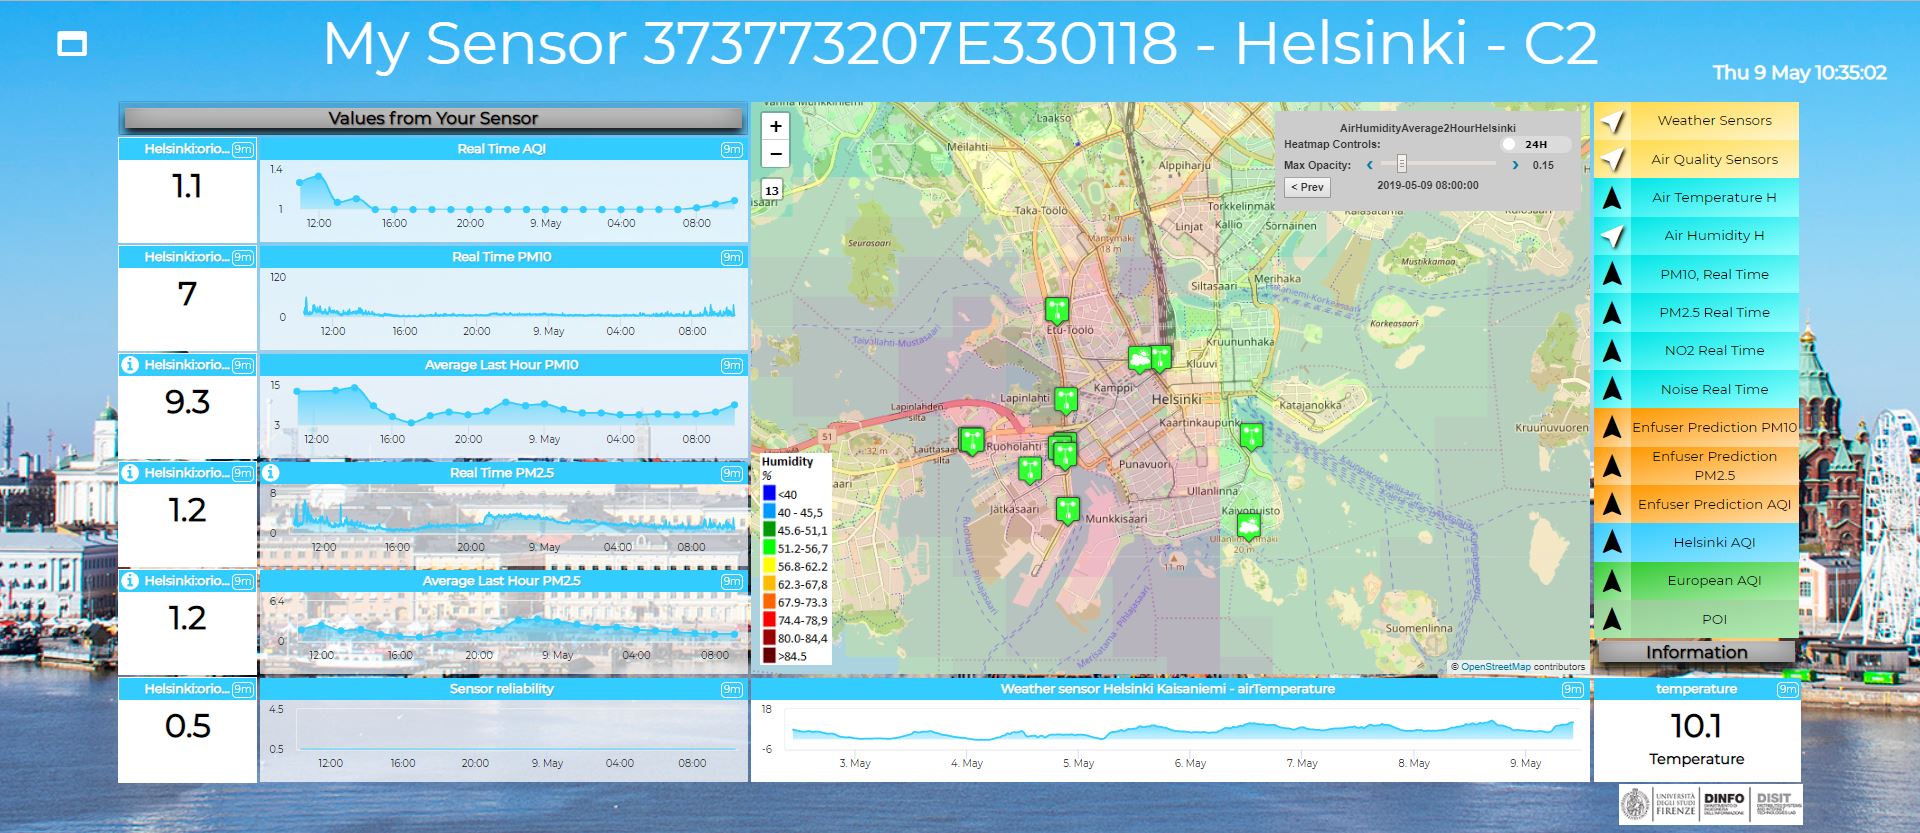
On the left you can see the real time values and the daily trends of the observed air quality measures for your sensor (Values from your sensor):
- RealTimeAQI: real time hourly value (updated to the current hour) of the Air Quality Index and daily trend updated every hour.
- Real Time PM10: real time last updated value of PM10 particles (measured in µg/m3) and daily trend updated every hour.
- Average Last Hour PM10: real time hourly value (updated to the current hour) of PM10 particles (measured in in µg/m3) and daily trend updated every hour.
- Real Time PM2.5: real time last updated value of PM2.5 particles (measured in µg/m3) and daily trend updated every a few of minutes.
- Average Last Hour PM2.5: real time hourly value (updated to the current hour) of PM2.5 particles (measured in µg/m3) and daily trend updated every a few minutes.
- Sensor reliability
On the right you can select to see on map:
- Weather Sensor: PINs about the location of weather sensors. You can click on them to see the values for each variable they measure, in real time, last 4 hours, last day, last week and last month.
- Air Quality Sensors: PINs about the location of air quality sensors. You can click on them to see the values for each variable they measure, in real time, last 4 hours, last day, last week and last month.
- Air Temperature H: real time heatmap of the air temperature in the Helsinki area. The heatmap is upgraded every 2 hours.
- Air Humidity H: real time heatmap of the air humidity in the Helsinki area. The heatmap is upgraded every 2 hours.
- PM10, Real Time: real time heatmap of pollutant levels in air in terms of PM10 particles (measured in µg/m3) in the Helsinki area. The heatmap is upgraded every 2 hours.
- PM2.5 Real Time: real time heatmap of pollutant levels in air in terms of PM2.5 particles (measured in µg/m3) in the Helsinki area. The heatmap is upgraded every 2 hours.
- NO2 Real Time: real time heatmap of pollutant levels in air in terms of nitrogen dioxide (NO2 measured in µg/m3) in the Helsinki area. The heatmap is upgraded every 2 hours
- Noise Real Time: real time heatmap of noise levels in the Helsinki area. The heatmap is upgraded every 2 hours.
- Enfuser Prediction PM10: heatmap of PM10 particles hourly Enfuser predictions (measured in µg/m3). The predictions related to the entire 24 hours are aviable clicking on the "Next" button on the Heatmap Controls widget.
- Enfuser Prediction PM2.5: heatmap of PM2.5 particles hourly Enfuser predictions (measured in µg/m3). The predictions related to the entire 24 hours are aviable clicking on the "Next" button on the Heatmap Controls widget.
- Enfuser Prediction AQI: heatmap of Air Quality Index hourly Enfuser predictions. The predictions of the entire 24 hours are aviable clicking on the "Next" button on the Heatmap Controls widget.
- Helsinki AQI (Air Quality Index used as a Standard in Helsinki from FMI): real time heatmap of air quality index in the Helsinki area. The resulting index from 1 to 10 indicate the quality of air. The map is upgraded every 2 hours.
- European AQI: real time heatmap of European Air Quality Index. The resulting index from 1 to 5 indicate the quality of air.
- POI (Point of Interest): PINs about the location of point of interest on the map
- PM10 Jätkäsaari: real time heatmap of pollutant levels in air in terms of PM10 (measured in µg/m3) particles in the Jätkäsaari Helsinki area. The heatmap is updedd every 1 hour. On the Heatmap Controls widget: the animated values of the entire 24 hours are available, as well as with "Prev" button the past heatmaps.
- PM2.5 Jätkäsaari: real time heatmap of pollutant levels in air in terms of PM2.5 (measured in µg/m3) particles in the Jätkäsaari Helsinki area. The heatmap is upded every 1 hour. On the Heatmap Controls widget: the animated values of the entire 24 hours are available, as well as with "Prev" button the past heatmaps.
- EAQI Jätkäsaari: real time heatmap of European Air Quality Index. The resulting index from 1 to 5 indicate the quality of air on the basis of the sensors in the Jätkäsaari Helsinki area. On the Heatmap Controls widget: the animated values of the entire 24 hours are available, as well as with "Prev" button the past heatmaps.
Forum Discussion:
- a Forum for collecting comments, requests to improve and discussion open among the users of the dashboard.
On the Map, several information may appear:
- PINs about POI where you can select a PIN to see information
- Name
- Description
- Details (Location and Adress)
- PINs about sensors where you can select a PIN to see information
- Details
- Description
- Real Time data: clicking on one of the buttons under the heading "Buttons" (Last Value, Last 4 hours etc.) the trend below the map change in according to the selected sensor (the name of each measred sensors can be found under the heading "Description"). The heading "Value" indicates the realt time measuring for each sensors description (according to the last update).
- Heatmap Information pop up when you click on a point of the map
- Description (Date & Time, Metric Name, Heatmap Value, Coordinates)
- Value (please note that the value could have been produced by interpolation or prediction according to the model that you are observing)
- Heatmap Controls widget positioned at the top right of the map with the name of the Heatmap
- Opacity: the slider that can be used to correct the opacity of the map
- "Next" and "Prev": the buttons can be used to display maps related to different date and times
- Animation: the swich "24H" to make the animation of the heatmaps related to the previous 24 hours
- the legenda of the heatmap positioned at the bottom left of the map
Below the Map:
- The initial trend value is referring to air temperature of: Weather sensor Helsinki Kaisaniemi
- Trends is used to visualize the data selected on the map, see above
Below the Selector on the right you can see:
- A single value referring to air temperature of: Weather sensor Helsinki Kaisaniem
- The single value is used to visualize the data selected on the map, see above
The data of this dashboard have been collected by Snap4City according to the PCP lanched by Select4Cities project.
The data sources used for creating this dashboard are listed in the following web pages:
Helsinki: https://www.snap4city.org/drupal/node/364
Antwerp: https://www.snap4city.org/drupal/node/363
 European Commission Affiliation Select4Cities project has received funding from the European Union’s Horizon 2020 research and innovation programme under grant agreement No 688196. Please note that this website represents the view of Snap4City, with the support of Select4Cities project and that the Commission is not responsible for any use that may be made of the information it contains.