Sustainable Urban Mobility Indicators (SUMI) are metrics used to evaluate how well a city’s mobility or transport system is progressing towards sustainability goals.
In the early 2010s, the European Commission (EC) promoted Sustainable Urban Mobility Plans (SUMPs) [1] as strategic tools for cities to plan cleaner, safer, and more inclusive mobility systems. However, many cities lacked a consistent and comparable way to measure progress toward sustainable mobility. To fill this gap, the EU initiated the SUMI project — Sustainable Urban Mobility Indicators [2], with support from the World Business Council for Sustainable Development (WBCSD) [3], which had previously developed the Sustainable Mobility Project 2.0 (SMP2.0) framework [4]. The SUMI project adapted and refined these indicators for the European urban context, aligning them with EU policy goals such as the EU Urban Mobility Framework, the European Green Deal, the TEN-T (Trans-European Transport Network) regulation, and the Sustainable and Smart Mobility Strategy.
According to the final version of the SUMI Harmonization Guideline [5], 18 indicators have been defined, divided into core and non-core indicators. Hereafter the list of the 18 SUMI is reported.
- Affordability of public transport for the poorest group: Share of the poorest quartile of the population's household budget required to hold public transport (PT) passes (unlimited monthly travel or equivalent) in the urban area of residence. (Core)
- Accessibility of public transport for mobility-impaired groups: This indicator determines the accessibility of public transport services to persons with reduced mobility. Such vulnerability groups include those with visual and audial impairments and those with physical restrictions, such as pregnant women, users of wheelchairs and mobility devices, the elderly, parents and caregivers using buggies, and people with temporary injuries. (Core)
- Air pollutant emissions: Air pollutant emissions of all passenger and freight transport modes (exhaust and nonexhaust for PM2.5) in the urban area. (Core)
- Noise hindrance: Hindrance of population by noise generated through urban transport. (Core)
- Road deaths: Road deaths by all transport accidents in the urban area on a yearly basis. (Core)
- Access to mobility services: Share of population with appropriate access to mobility services (public transport). (Core)
- Greenhouse gas emissions (GHG): Well-to-wheels GHG emissions by all urban area passenger and freight transport modes. (Core)
- Congestion and delays: Delays in road traffic and in public transport during peak hours compared to off peak travel (private road traffic) and optimal public transport travel time (public transport). (Core)
- Energy efficiency: Total energy use by urban transport per passenger km and tonne km (annual average over all modes). (Core)
- Opportunity for active mobility: Infrastructure for active mobility, namely walking and cycling. (Core)
- Multimodal integration: An interchange is any place where a traveller can switch from one mode of travel to another, with a minimum/reasonable amount of walking or waiting. The more modes available at an interchange, the higher the level of multimodal integration. (Core)
- Satisfaction with public transport: The perceived satisfaction of using public transport. (Core)
- Traffic safety active modes: Fatalities of active modes users in traffic accidents in the city in relation to their exposure to traffic. (Core)
- Quality of public spaces: The perceived satisfaction of public spaces. (Non-core)
- Urban functional diversity: Functional diversity refers to a mix of spatial functions in an area, creating proximity of mutual interrelated activities (Non-core)
- Commuting travel time: Duration of commute to and from work or an educational establishment, using any types of modes. (Non-core)
- Mobility space usage: Proportion of land use, taken by all city transport modes, including direct and indirect uses. (Non-core)
- Security: The perceived risk of crime and passenger security in urban transport. (Non-core)
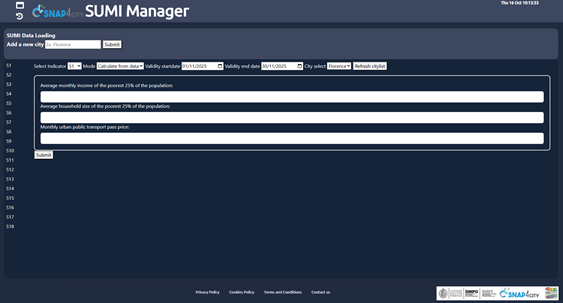
To facilitate municipalities and urban officers, Snap4City integrate and provide the SUMI Manager, a tool to ingest, compute and visualize the SUMI. Developed following the provided guidelines, the manager is accessible thought a dashboard composed by two main parts, as illustrated in Figure 1.
|
|
|
|
|
(a) |
(b) |
|
|
Figure 1: SUMI Manager of Snap4City |
||
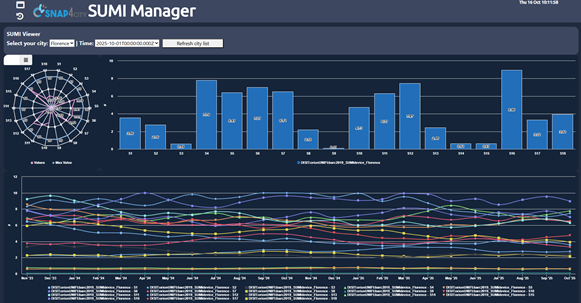
In Figure 1(a) the inserted SUMI can be visualized. After selecting the city of interest and the reference datetime, the manager retrieves the data from Snap4City and present it using a kiviat and histogram of the specified SUMI instance, and a time trend illustrating the evolution of SUMI over time for that city. Such a visualization exploits all the interactivity of the dashboard widget offered by Snap4City allowing the user to interact and inspect the plots.
In Figure 1(b) the SUMI loading interface is presented. The user can instantiate new city and insert new SUMI for the managed cities. SUMI can be loaded in two different ways:
- Direct entry: the user enters directly the SUMI value for each indicator and after clicking on submit the data are stored into Snap4City, ready to be visualized.
- Calculate from data: in this case the user is asked to fill all the source information required to compute the SUMI. After clicking on submit, data are sent to backend processes that perform the calculation to obtain the final indicators and save them into Snap4City.
|
|
|
Figure 2: Calculate from data modality for SUMI S15 |
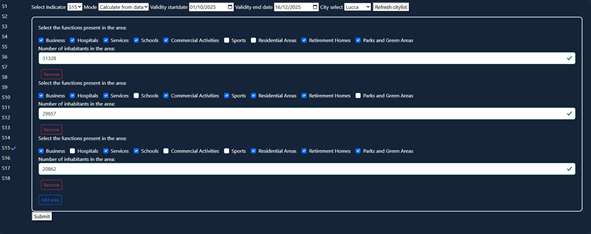
In Figure 2 an example of Calculate from data modality is provided for SUMI S15. Indicator 15 assesses the diversity of functions within the area. To calculate it, the territory must be divided into zones in which the presence of various functions is evaluated. The interface allows users to add different zones using the “Add area” button at the bottom left. For each zone, the user must select the services available and enter the number of residents. Each added zone can be independently removed using the “Remove” button below. After filling the information, data are sent to the backend and S15 is automatically computed.
---
[1] European Commission, “Sustainable urban mobility planning and monitoring.” Available online: https://transport.ec.europa.eu/transport-themes/urban-transport/sustainable-urban-mobility-planning-and-monitoring_en
[2] EuroCities, “Sustainable Urban Mobility Indicators Project.” Available online: https://eurocities.eu/projects/sustainable-urban-mobility-indicators/
[3] World Business Council for Sustainable Development (WBCSD). Available online: https://www.wbcsd.org/
[4] WBCSD, “Sustainable Mobility Project 2.0 (SMP2.0).” Available online: https://www.wbcsd.org/resources/smp2-0-sustainable-mobility-indicators-2nd-edition/
[5] “Technical support related to sustainable urban mobility indicators (SUMI), Harmonisation Guideline,” 2020. Available online: https://transport.ec.europa.eu/system/files/2020-09/sumi_wp1_harmonisation_guidelines.pdf