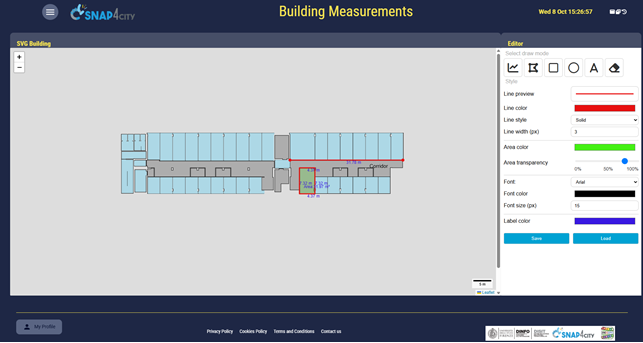
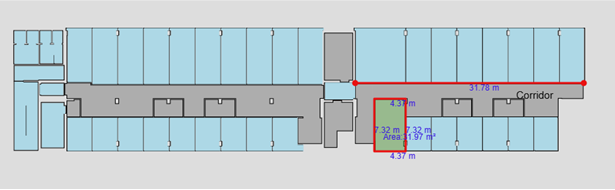
Building/floor Measures
Tool on Dashboard: https://www.snap4city.org/dashboardSmartCity/view/Gea-Night.php?iddasboard=NDczNA==
Project goal is to create a toolbox that let user select drawing tools and their customization (such as color, line style, font, font size and use them in a map where is loaded a plant of a building or a floor in SVG (Standard Vector Graphics) format and measure user’s features of interest. Then user can save/load its work.
Toolbox description
Toolbox is divided into three section:
- Drawing tool: let user choose the current drawing tool
- Customization: let user customize the style of the drawing
- Controller: let user save and load the work
Drawing tool
User can select one tool at time from this list:
- Polyline: clicking on the map set an endpoint of the current segment. More segments can be created at once. While using this tool a label containing segment length (in meters) is shown and updated dinamically. To end the drawing double click is required. At the end a resumed popup is shown, presenting each segment length and the total length.
- Polygon: clicking on the map set an endpoint of the current segment. More segments can be created at once. While using this tool a label containing segment length (in meters) is shown and updated dinamically. To end the drawing double click is required. Alternatively clicking on the first endpoint end the draw. At least 3 markers are required to stop the draw. At the end a resumed popup is shown, presenting each segment length, polygon perimeter and area.
- Rectangle: to draw a rectangle user must click and drag. To end the shape user has to release the mouse. While using this tool a popup containing sides length (in meters) is shown and updated dinamically (width x height). At the end a resumed popup is shown, presenting rectangle width, height, perimeter and area.
- Circle: to draw a circle user must click and drag. To end the shape user has to release the mouse. The starting point is the center of the circle. While using this tool a popup containing radius length (in meters) is shown and updated dinamically. At the end a resumed popup is shown, presenting circle radius, circumference and area.
- Textbox: create a textbox at the center of the map. This is used to create a custom label where user can write own text. Label can be dragged around and resized from right, bottom or both sides.
- Eraser: remove the clicked shape/textbox and its associated measures
Customization
Before using any tool user can customize result style in this way:
- line color: set line color
- line style: set line style (solid, dashed or dotted)
- line width: set line width (in pixel)
- area color: set area color (for polygons, rectangles and circles)
- area transparency: set area transparency
- font: set font family (arial, courier new, times new roman, verdana). Only for textbox
- font color: set font color. Only for textbox
- font size: set font size (in pixel). Only for textbox
- label color: set measurement labels color
Controller
User can make two actions: load and save data.
- Save
- Save: create a new instance of a current loaded device.
- Save as: create a new device with first instance. To create a device user must choose a name and the coordinates (lat;lng) of bottom-left and top-right point of the figure. Name cannot contains these characters: < > " ' = ; ( ) white spaces. User cannot create more than one device with the same name
- Load
- Load device: user can choose from own device list the instance to be loaded. Also can choose the data kind to be loaded (map data or svg data)
- Load svg: user cun input the url of svg and its scale (in meter per pixel)
Usage
svg : https://www.snap4city.org/dashboardSmartCity/img/synoptics/236166475.svg
svg scale: 0,095
First, user has to load the svg where he wants work on, inserting scale and url.
After that user can customize and use drawing tools on it.
In the end user save (in save-as mode) to create his first device and instance, inserting name and coordinates.
User now can reload that instance.
Finally user can update the device creating a new instance (save mode) or creating new device (save-as mode), inserting new name and coordinates.
Map Measurements
Tool on Dashboard: https://www.snap4city.org/dashboardSmartCity/view/Gea-Night.php?iddasboard=NDczNQ==
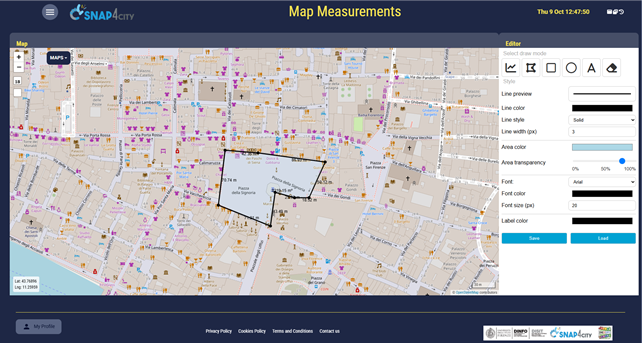
Introduction
Project goal is to create a toolbox that let user select drawing tools and their customization (such as color, line style, font, font size and use them in a map and measure user’s features of interest. Then user can save/load its work.
Description and usage are similar to Building Measurements with these differences:
- User cannot load svg building. Only device data.
- To end polygon drawing user must click the first endpoint. Double click doesn’t work.
- Scale used is the map scale.
- On bottom left angle there is the current mouse position in coordinates.
-- end --