Dashboard People Flow Analysis: People Counting and Origin-Destination Matrices
https://www.snap4city.org/dashboardSmartCity/view/Gea.php?iddasboard=NDQ4Mw==
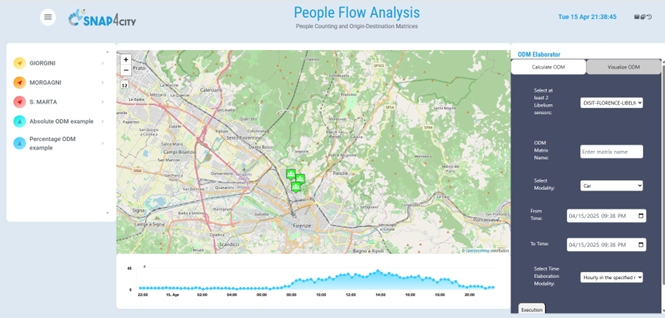
The above Dashboard is made up of 2 main components:
- The Selector and Map on the left, which is responsible also for the time-trend analysis
- The right panel which si responsible for the generation and visualization of Origin-Destination Matrixes, ODM in standard ODM:
The Selector and Map
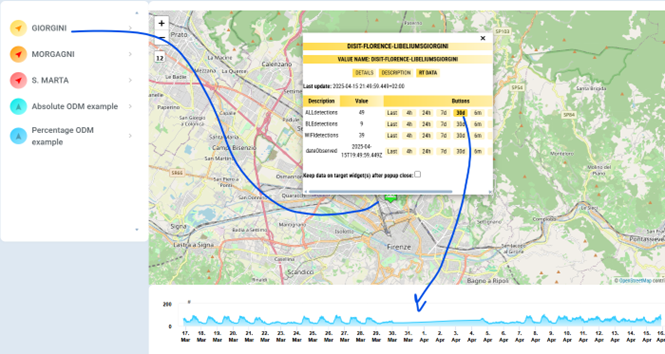
Via the selector the user can visualize on the map the current three installed sensors, they are typically PAXCounter, for example Libelium PAXCounters: For the example they are located on
- Giorgini, Florence
- Morgagni, Florence
- S.Marta, Florence
Once these are present on the map the user can click on the pin and the visualization shows the sensors data information such as the last number of sniffed visitors both Wifi, BLE or both. The popup on the sensor is responsible for controlling the visualization on the time-trend under the map.
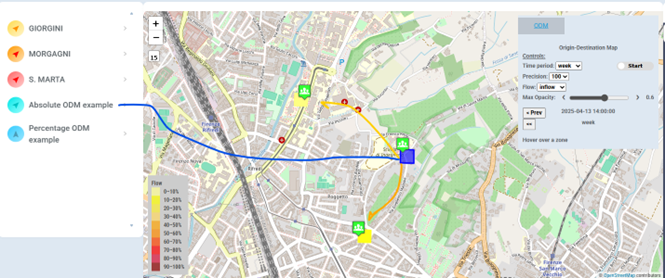
The two other selector buttons are responsible for displaying on the map 2 examples of ODM.
The first one is about absolute values and the other percentages of visitors that in the specific chosen time displayed on the top right part of the map traversed into or out the specific area monitored by the sensor. In this case the Area of Interest has been taken from MGRS in reality the are is a circle of 50mt of ray.
ODM elaborator
The ODM elaborator has two tabs. The first one is responsible for managing the generation of the ODM exploiting the data sniffed by the preferred sensors; while the other is responsible for the visualization of the ODM generated on the map.
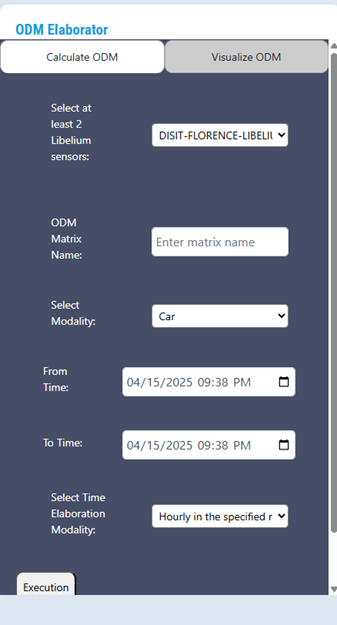
On the first tab it is possible to define:
- The sensors of the sniffer on the basis to construct the ODM
- The name of the ODM
- The modality of determining the time ranges based on the people flow (car, bikes, foot)
- The fromTime and toTime of the ODM elaboration
- The time granularity (Hourly, Daily) or regariding the single shot evaluation from the first chosen slot fromTime.
The Execution launches the ODM elaboration that can take some time.
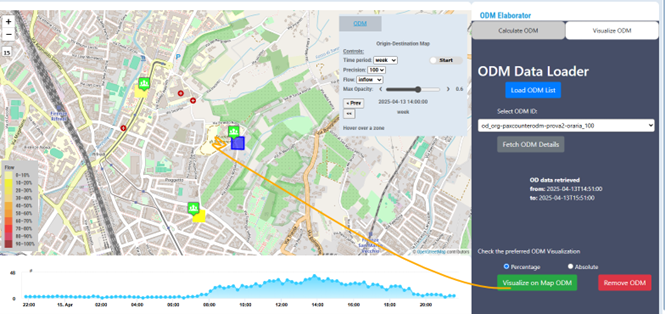
The ODM Data Loader will provide to the user the ODM available for the visualization on map.
The provided list will be used by the user to select the ODM.
The system will load the information and then the user will select if the visualization will be about percentages of absolute values
Via the two buttons the user can visualize on map the ODM and remove it from the map.