Snap4PVenergy: Online Photovoltaic System Simulator
It aims to provide a tool to evaluate the installation of a photovoltaic system with the possibility of accumulation. More generally, it is possible to carry out a simulation of the sizing of the system based on some parameters such as power consumed, battery size, energy costs, and depreciation duration.
The simulator is based on real data taken from homes in the province of Florence (both in terms of consumption and photovoltaic system), and provides simulation through a Business Intelligence solution developed in a Snap4City environment using CSBL Client-Side Business Logic Widget Manual technology: https://www.snap4city.org/download/video/ClientSideBusinessLogic-WidgetManual.pdf
The online tool is available at this link.
https://www.snap4city.org/dashboardSmartCity/view/Baloon.php?iddasboard=MzczNg==
Below is a description of the individual charts shown in the dashboard.
Plant Parameters
The PV plant is supposed to be of 3KW. The cost of the PV plant has been supposed to be of 1500Euro, PV + Battery of 2.4kWh : 2640Euro, PV + Battery of 3kWh : 3300Euro, PV + Battery of 3kWh : 3300Euro, PV + Battery of 4.8kWh : 5280Euro, PV + Battery of 5kWh : 5500 Euro, PV + Batteriy of 6kWh : 6600Euro, PV + Battery of 7.2kWh : 7920Euro, PV + Battery of 10kWh : 11000 Euro, PV + Battery of 15kWh : 16500 Euro.
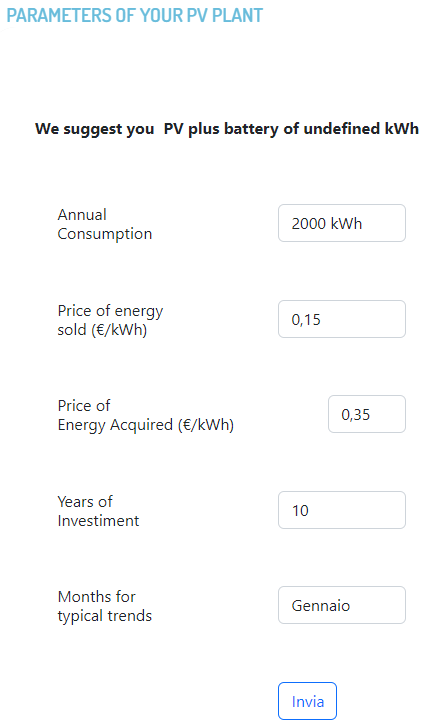
In the form it is possible to parameterize the system to be simulated with the various graphs present. It is required to know the annual consumption of the house (and therefore place itself in an annual consumption group), the selling price of energy per kWh and the purchase price of energy per kWh. Alternatively, simulation can be performed with pre-set parameters. In addition, the number of years in which you want to distribute the cost in depreciation must be entered and also a typical month from which to request the display of typical weekly economic and energy enhancement graphs. The recommended type of plant is also displayed at the top based on the graph "Total cost in investment years". The system gives you advice based on your parameters and shows you why. Obviously, they are simulated data based on typical behavior and not that of your home, so they should not be taken for personalized results on your case. You can make a comparison by comparing your consumption with those of the typical weekly trend shown at the bottom of the simulator page.
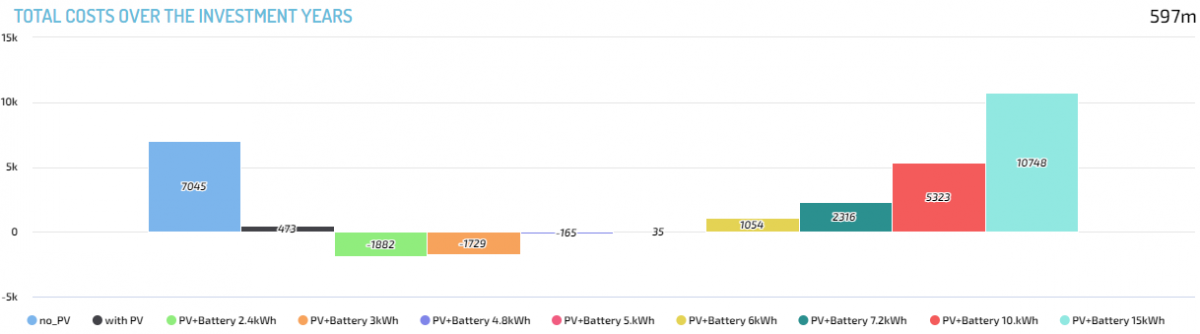
Total cost/income over investment years
This graph shows the total cost/revenue in N years that should be incurred / obtained for the various types of plant. Where these are positive, they represent a cost, where they are negative they represent a revenue. The minimum among all these values is the type of system that we recommend based on the parameters set. For example, given your annual consumption with a system: A) without storage you would have a total cost of 69 euros, B) with a 2.4 kWh battery you would have a revenue of 2441 euros at the end of the N years.
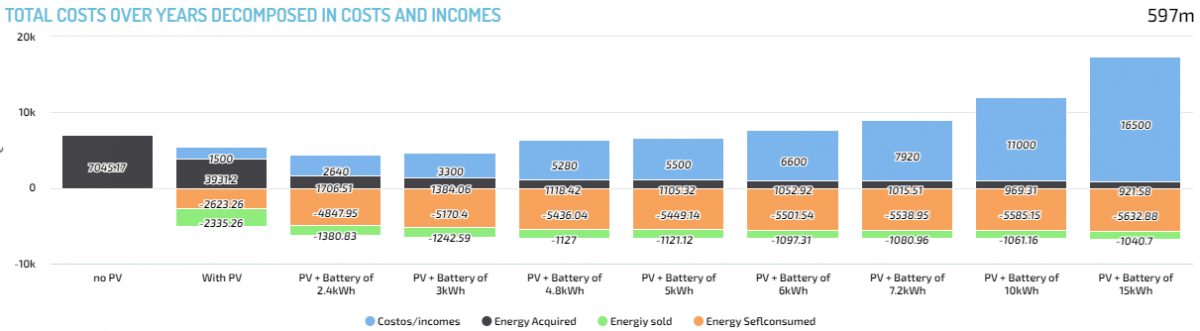
Total cost in years of partitioned investment
This representation of the total cost is divided into four categories: Cost of the plant, Total energy purchased (in x years), Total energy sold (in x years), Total self-consumed energy (in x years). Self-consumed energy is multiplied by the purchase price because it is considered as a saving, i.e. energy that is not purchased from the supplier. Here, too, negative prices represent an income. For example, it is noted in this case that for the consumption of this user, the system that allows you to have the highest receipts turns out to be that of 3kWh of accumulation in which there are expenses for 3300 + 2633 and revenues of 6504 + 2048 euros.
Total cost/income in years of partitioned investment
Annual cumulative price trend
It represents a more detailed view of the total annual prices you would incur with the various types of implant (next figure). On the x-axis there are the N years of investment starting from the year following the current one. In this case, you can see when the implant you have unveiled pays off. For example, in the case of the figure below, the 3kWh battery system reaches the y-axis by 0, in the year 2028 approximately, shortly after the 2.4kWh battery system, but with a higher revenue in the future. There are also larger battery plants that do not break even by 2033.
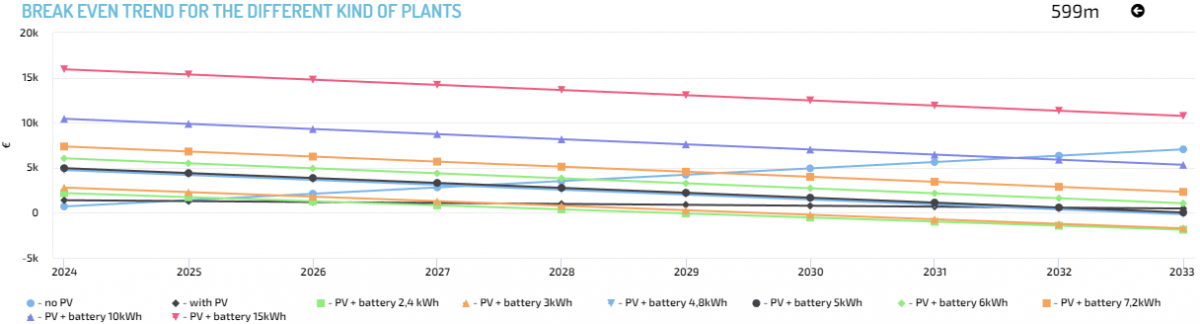
Annual cumulative price trend
Example of Energy Valorisation in the period chosen by form
Using the data of fictitious dwellings (with hourly density), this graph shows a possible trend in consumption, production and battery for the selected month based on the type of system recommended (in the form).
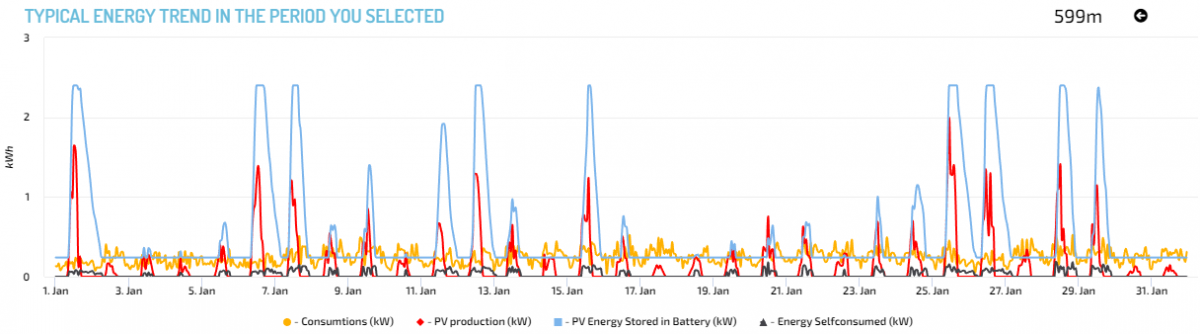
Energy valorization, according to the recommended system
Example of Economic Valorization in the period chosen by the form
Taking advantage of the previous graph and the sales and purchase values of energy set, the economic trend of the energy purchased, the energy sold and the self-consumed energy is displayed.
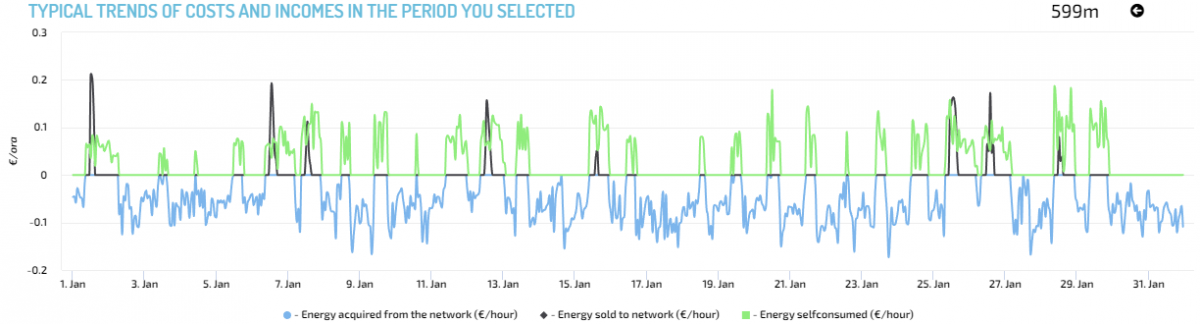
Example of economic enhancement, based on the recommended system