DORAM Introduction
Demand OffeR Analyzer for Mobility (DORAM) is a tool which:
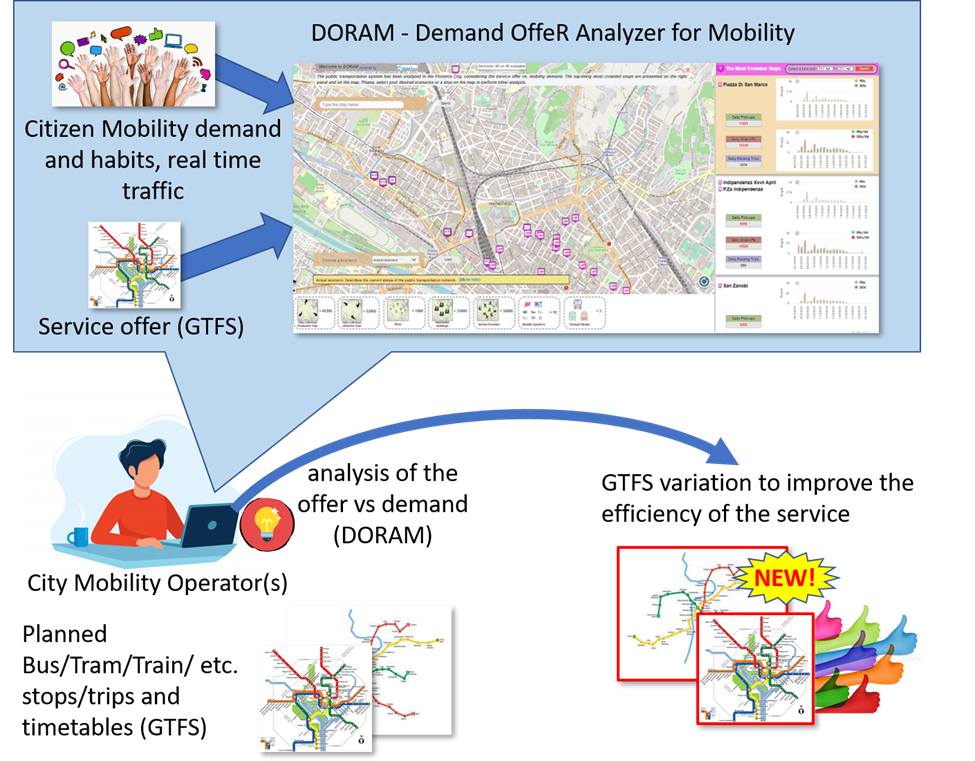
- aims at analyzing public transport systems by comparing service offer and mobility demand which form a scenario (see Figure 1);
- can be used as a suitable tool for anomaly detection in public transport scenarios. For example, overcrowded stops, overloaded vehicles, not covered areas, etc;
- enables users to define new scenarios, analyzing the impact of the changes done compared to the current state
The service offer is analyzed estimating the number of people who (mainly students and workers) can be moved from a locality to another on a typical working day, considering the daily public vehicle trips. The analysis is based on GTFS data, containing details on bus/train/tram stops, trips, and timetables. GTFS are periodically updated by public transport operators and are automatically analyzed, enriched, and added to the Snap4City Knowledge Base whenever they change, in compliance with the Smart City multi-ontology Km4City.
The simplified default procedure of working with DORAM tool is as follows (see Figure 1):
- The description of the new scenario, that is scenario , along with other available scenarios, are presented in DORAM graphical user interface, using DORAM API (which is implemented by Spring framework).
Figure 1. Simplified DORAM overview
DORAM Main Features
DORAM tool, which can be accessed here, provides several features to support DORAM users when they analyze the public transport system in a smart city. Main features that enable DORAM to stand out from the crowd are:
- Fast computationally. Thanks to the designed architecture of DORAM, the user can conveniently and efficiently analyze the actual scenario and alternative ones by easily switching between them;
- Multi-modal. DORAM supports different transportation (e.g., bus, tram, train) depending on the considered Smart City;
- Multi-operative. Typically, in a Smart City many, there are several operators that provide public transport network services. DORAM is then able to manage all possible interactions by analyzing multimodal movements and managing data coming from different providers. For example, in the city of Florence DORAM supports several mobility operators (e.g., ATAF, BUSITALIA, COPIT, CTT Nord Lucca, TIEMME SPA, GEST).
DORAM Services
In Figure 1, the main view of DORAM is shown, on the right, Stop Panel is shown which presents the most crowded stops in the city in decreasing order with the possibility to navigate through all the stops, using the previous and next buttons on the bottom of the panel. For each stop, the following Key Performance Indicators (KPIs) and diagrams are present:
- The number of daily Pick-Ups (see Figure 2)
- The number of daily Drop-Offs (see Figure 2)
- The number of daily passing Vehicle Trips (see Figure 2)
- Diagrams presenting:
- Pick-Ups (PUs) and Drop-Offs (DOs) in each timeslot (see Figure 2)
- Pick-Ups (PUs/VA) and Drop-Offs per Vehicle Arrival (DOs/VA) in each timeslot (see Figure 2)
- Pick-Ups (PUs) and Drop-Offs (DOs) in each timeslot, for each line passing through the stop respectively by clicking on Daily Pick-ups and Daily Drop-offs (see Figures 3 and Figure 4)
- Number of Vehicle Trips in each timeslot, for each line passing through the stop by clicking on Daily Vehicle Trips (see Figure 5)
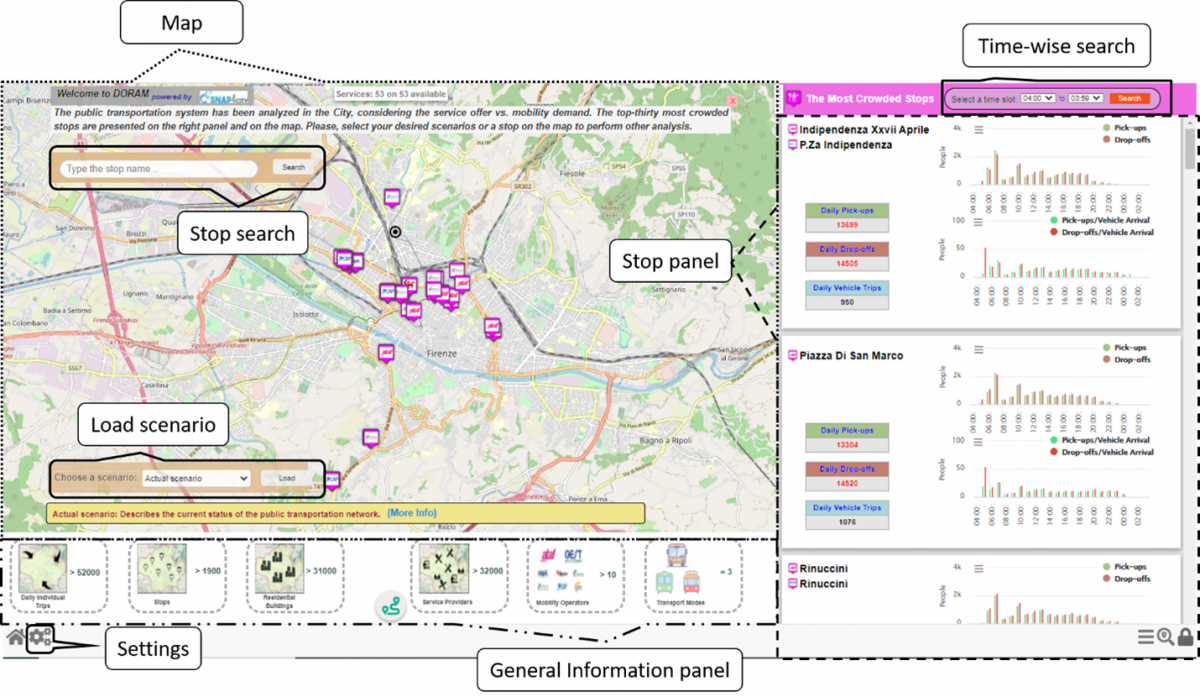
Figure 2. DORAM main view
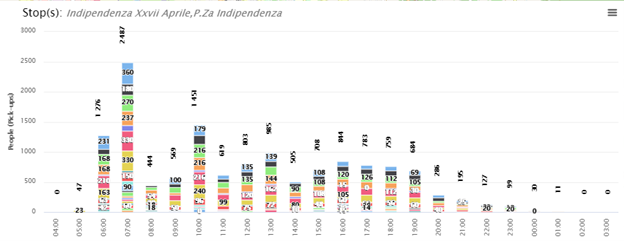
Figure 3. Pick-ups w.r.t. each line
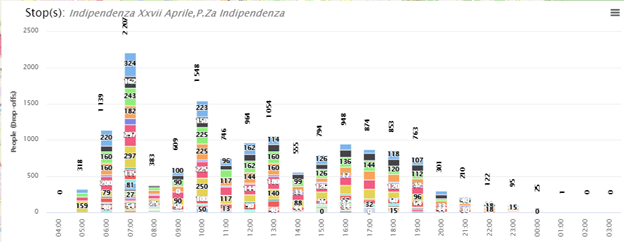
Figure 4. Drop-offs w.r.t. each line

Figure 5. Trips w.r.t. each line
DORAM Additional Services
In addition to the described services, DORAM provides other services and feature, briefly described as follows:
- Time-wise search, which is available on the top of the Stop Panel, to search the results in a specific time slot (see Figure 2)
- Map, showing the stops present in the Stop Panel (see Figure 2)
- General information panel, which provides the following Smart City KPIs (see Figure 2):
- Total number of stops and trips (connected to the City Mobility Operators Offer)
- Daily individual Trips (connected to the Citizens Demand)
- Number of residential buildings and service providers in the Smart City (Points of Interest (POIs))
- Number of transport modalities analyzed (connected to the City Mobility Operators Offer (e.g. Train, Tram, Bus)
- Area search button, which enables finding stops in an area by selecting a point on the map, and then, clicking on the magnifier icon ( ) on the right-downside of the map. The user can find results for the stops in a circle around the point (see Figure 6).
- Settings button ( ), which opens settings page to set different parameters, including the radius for a search around a pin put by the user on the map. The radius default value is 300 (m) (see Figure 2).

Figure 6. Search stops in an area
- Stop information panel. If a user clicks on a stop icon in the map, a pop-up with the stop Daily number of Pick-up and Drop-off is visible, and on the right, a Stop information Panel appears showing more information regarding the selected stop, including the associated lines and schedule (see Figure 7).
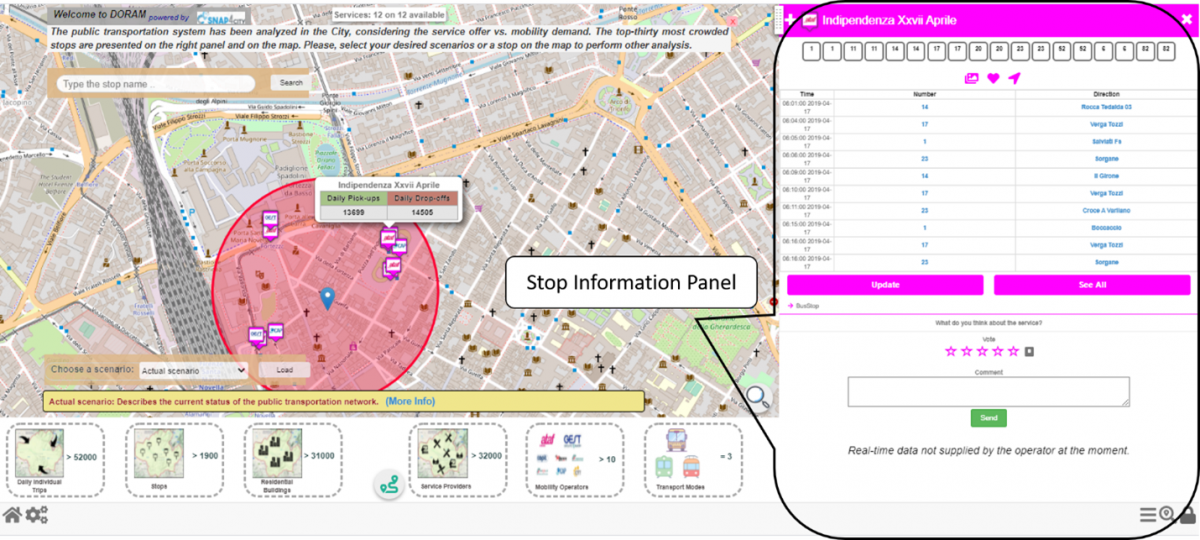
Figure 7. Stop information Panel
- Route direction list. By clicking on each line number in Stop Information Panel, it is possible to see all line directions referred to the selected stop (see Figure 8).
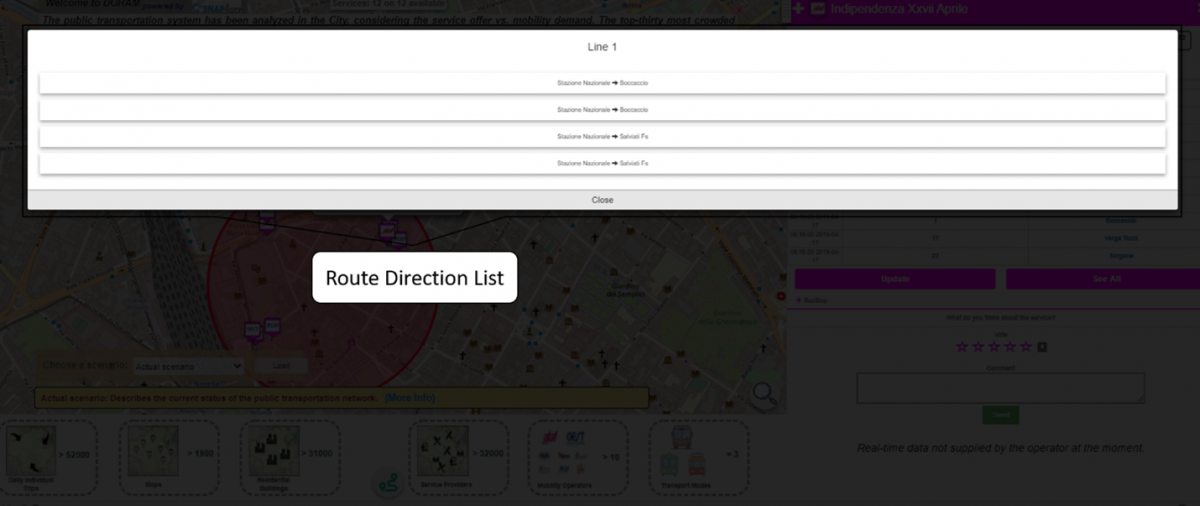
Figure 8. Route direction list
- Route information panel. By clicking on each route direction in Route direction list, it is possible to see the list of the stops of the selected route, both in a right panel and in the map (see Figure 9).
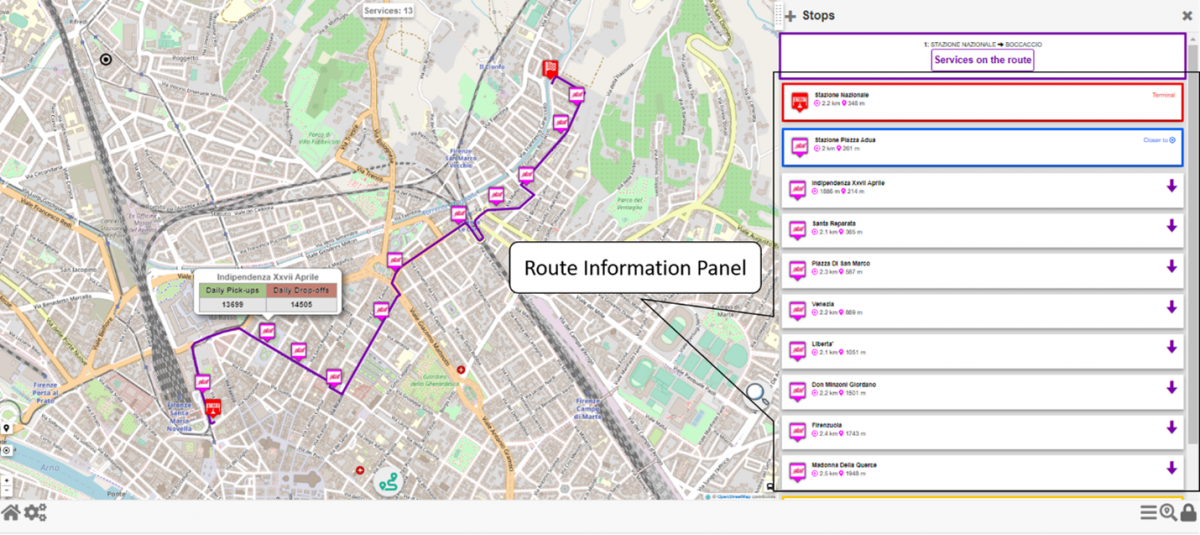
Figure 9. Route information panel
- On-route services. By clicking on Services on the route button in the Route information panel, it is possible to see all services on the route in the right panel and on the map (see Figure 10).
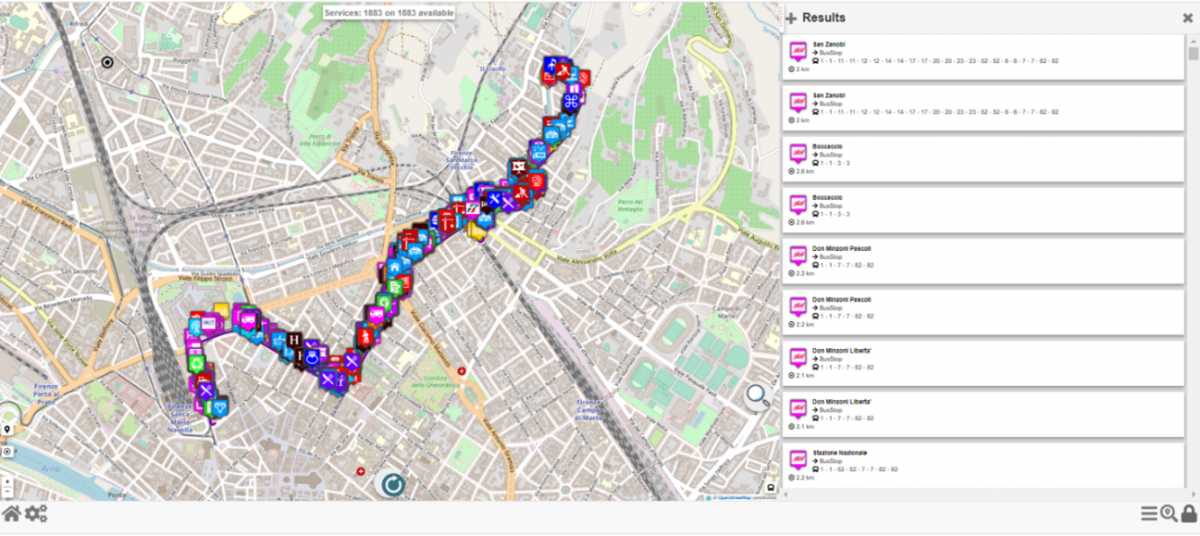
Figure 10. On-route services
DORAM Actual Scenario
The main DORAM final users are City Mobility Operators (releasing the GTFS) who can use the tool not only to improve their services for citizens but also to optimize their internal resources. To do so, analyzing the current status of a public transport system, is absolutely essential. When the DORAM tool is first accessed, it allows the users to see the Actual scenario describing the current status of the public transport system in a Smart City. It is the starting point to make a comparison between service offer and mobility demand. Analyzing the Actual scenario, it is possible to inspect the status of public transport and identify possible main problems related to the services offered according to user requirements and interests. In the following, using DORAM, the main ways to identify problems in a public transportation network are briefly presented. For example, it is possible to understand if:
- there is an anomaly in: 1) the schedule of trips for a stop, and as a result, they cannot suitably meet the schedule of people (e.g., for work or study); 2) the number of waiting people at the stop; 3) the number of pick-ups and/or drop-offs at the stop, in a time slot or in the whole day; 4) sufficient stops are available in multimodal hubs (e.g., public parking) or if a (set of) stop(s) must be added there. To do so, the user can use (Daily) Pickups and/or Drop-offs diagrams (tables) in the stop panel (see Figure 2)
- there is an anomaly in the number of pick-ups and/or drop-offs at a stop, in a time slot, w.r.t. each line that passes through the stop using the respective diagram by clicking on Daily Pick-ups and/or Daily Drop-offs in the Stop Panel (see Figures 3 and Figure 4)
- there is an anomaly in the number of trips passing a stop, w.r.t. to moving people in the whole day using Daily Vehicle trips table in the Stop Panel (see Figure 5)
- there is an anomaly in the on-board number of vehicle trips using Pick-ups/Vehicle Arrivals and Drop-offs/Vehicle Arrivals diagrams (see Figure 2)
Problem Solving Approach
Using DORAM, when problems and anomalies detected by the user, He/she can make a simulation by creating a new scenario and analyze the public transportation network by making a comparison between the Actual (and real) scenario and the newly created one. Creating a new scenario could include making changes in the network such as:
- changes in the timetables
- adding or removing a (set of) trip(s)
- adding or removing (a set) of stop(s)
- changing the location of (a set) of stop(s)
, just to mention a few, and see how the network behaves in response to such changes. For details on how to create alternative scenarios, one can refer to here. As an example, DORAM provides the following two alternative scenarios:
- Alternative scenario 1, which focuses on balancing the number of people who are picked-up (or dropped-off) at the most crowded stop in a time slot, according to DORAM, compared to Actual Scenario, by adding a new stop and transferring a (set of) line(s) (and the related trips) that pass through the stop to the new stop, and as a result, and asking those who want to take the transferred lines to move to the new stop, and as a result, it is possible to distribute people at the most crowded stop (for details, see here).
- Alternative scenario 2, which investigates on balancing the number of people who are picked-up (and dropped-off) at the most crowded stop in a time slot, according to DORAM, on each vehicle arrival, compared to Actual Scenario, by increasing the number of vehicle trips that pass through the stop in the time slot. Therefore, while the total numbers of pick-ups and drop-offs in the time slot do not change, for each vehicle trip in the time slot, the number of people who are picked-up and dropped-off at the stop, will be decreased (for details, see here).