This Dashboard is dedicated to Environmental professionals. The idea is to show the values of main environmental data in real time with respect to the predictons data provided by Enfuser service. This dashboard shows the daily trends, while there is another structurally identical dashboard with weekly trends and comparisons. The comparison of Enfuser vs Real Time values is referring to specific sensors located in the Jätkäsaari island. The dashboad has been produced by Snap4City team, you can find more and more information on Https//www.snap4city.org
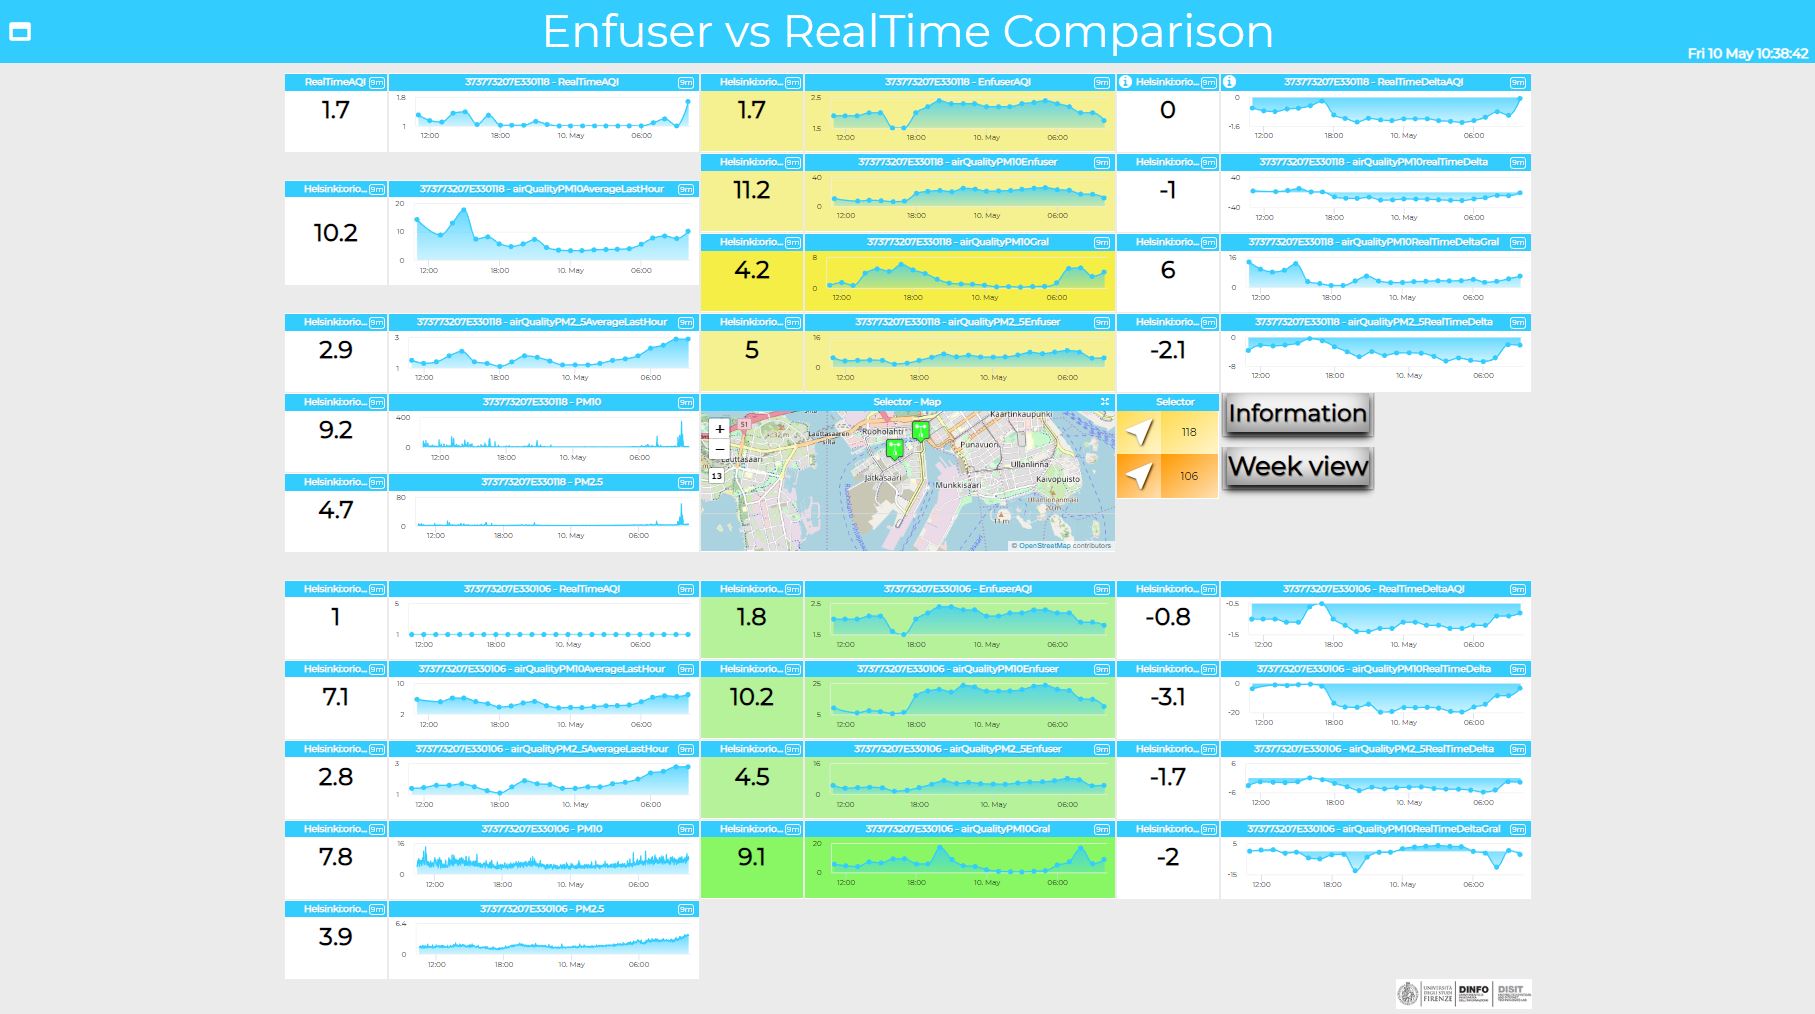
Daily: https://www.snap4city.org/dashboardSmartCity/view/index.php?iddasboard=MTczMg==
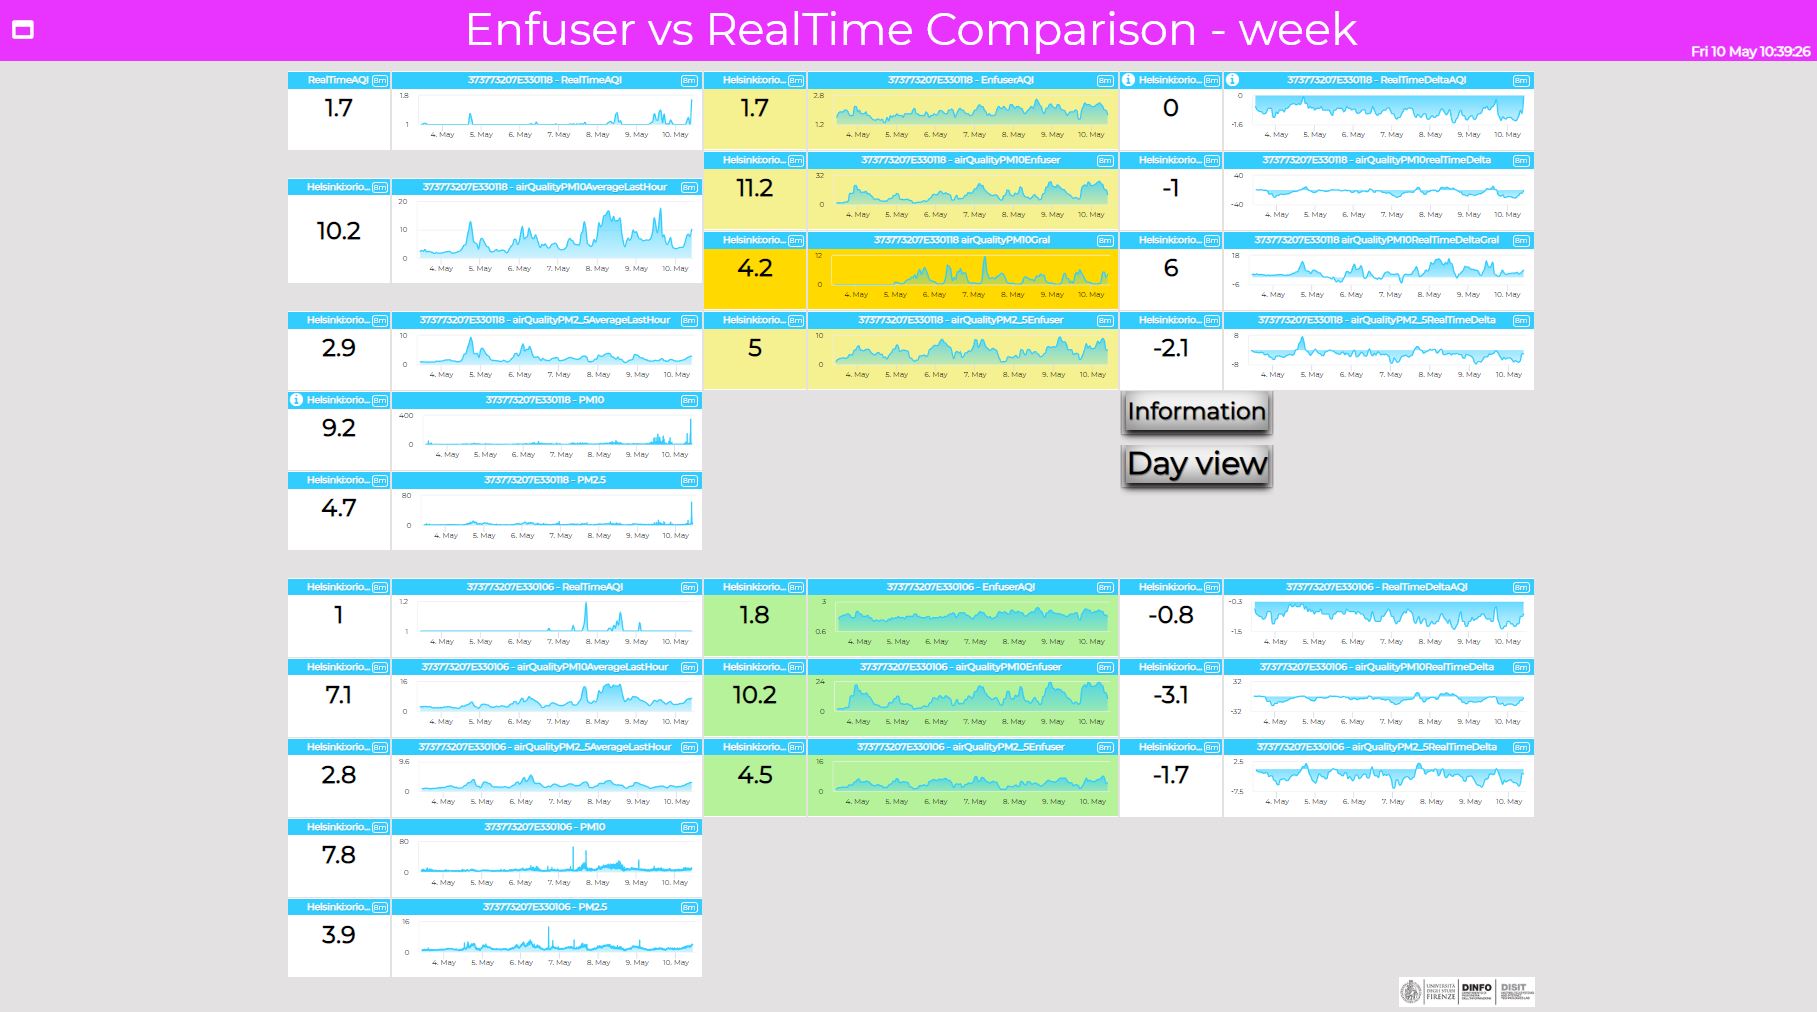
Weekly: https://www.snap4city.org/dashboardSmartCity/view/index.php?iddasboard=MTczNQ==
Please read https://www.snap4city.org/drupal/node/435 for the definitions of the measured and computed values.
On the left you can monitor the widgets related to real time values and the daily/weekly trends of the observed air quality measures for the sensors 373773207E330118 (above in the dashboard) and 373773207E330106 (below in the dashboard):
- RealTimeAQI: real time hourly value (updated to the current hour) of the Helsinki Air Quality Index and daily/weekly trend updated every hour.
- airQualityPM10AverageLastHour: real time hourly value (updated to the current hour) of PM10 particles (measured in µg/m3) and daily/weekly trend updated every hour.
- airQualityPM2_5AverageLastHour: real time hourly value (updated to the current hour) of PM2.5 particles (measured in µg/m3) and daily/weekly trend updated every hour.
- PM10: real time last updated value of PM10 particles (measured in µg/m3) and daily/weekly trend updated every few minutes.
- PM2.5: real time last updated value of PM2.5 particles (measured in µg/m3) and daily/weekly trend updated every few minutes.
In the middle you can monitor the values produced by Enfuser/Gral predictions for the same location of sensor:
- RealTimeAQIEnfuser: Enfuser hourly value (updated to the current hour) of the Air Quality Index and daily/weekly trend updated every hour.
- airQualityPM10Enfuser: Enfuser hourly value of PM10 particles (measured in µg/m3) and daily/weekly trend updated every hour.
- airQualityPM10Gral: hourly predicted value of PM10 particles (measured in µg/m3) computed with Gral model and the daily/weekly trend updated every hour for the location of sensor.
- airQualityPM2_5Enfuser: Enfuser hourly value of PM2.5 particles (measured in µg/m3) and daily/weekly trend updated every hour.
- A map reporting PINs related to the considered sensors. On the right of the map is positioned a selector that allows to add the sensor to the map.
On the right you can monitor the trends related to the differences between the real time values and the enfuser/gral (predicted) values for the sensors:
- RealTimeDeltaAQI: difference between the real time hourly value and the enfuser value of the Air Quality Index and daily/weekly trend of the differences updated every hour.
- airQualityPM10realTimeDelta: difference between the real time hourly value and the enfuser value of PM10 particles (measured in µg/m3) and daily/weekly trend of the differences updated every hour.
- airQualityPM10RealTimeDeltaGral: difference between the real time hourly value and the predicted value with Gral model of PM10 particles (measured in µg/m3) and the daily/weekly trend of the differences updated every hour.
- airQualityPM2_5RealTimeDelta: difference between the real time hourly value and the enfuser value of PM2.5 particles (measuredin µg/m3) and daily/weekly trend of the differences updated every hour.
On the Map, several information may appear, we suggest to go the map in a larger view is needed:
PINs about sensors where you can select a PIN to see information
- Details, Description
- Real Time data: clicking on one of the buttons under the heading "Buttons" (Last Value, Last 4 hours etc.) the trend below the map change in according to the selected sensor (the name of each measred sensors can be found under the heading "Description"). The heading "Value" indicates the realt time measuring for each sensors description (according to the last update).
The data of this dashboard have been collected by Snap4City according to the PCP lanched by Select4Cities project.
The data sources used for creating this dashboard are listed in the following web pages:
Helsinki: https://www.snap4city.org/drupal/node/364
Antwerp: https://www.snap4city.org/drupal/node/363
 European Commission Affiliation Select4Cities project has received funding from the European Union’s Horizon 2020 research and innovation programme under grant agreement No 688196. Please note that this website represents the view of Snap4City, with the support of Select4Cities project and that the Commission is not responsible for any use that may be made of the information it contains.