data ingested by IoT processes and IoT App in terms of Entities or Devices can experience errors and probems due to devices, connections, processes, etc. The Healthiness in Snap4City is performed at level of the single attribute (sensors) of each device/entity. This allow to detect the problems on single variable/sensors and on the whole device.
On Snap4City a number of solutions are set up to control their healthiness.
- Each device has a declared data rete, the ingestion process in Ni-Fi and Km4City / ServiceMap may control at the ingestion time if the rate is satified, and if the data are coming at least once per day. If not the healthiness flag on Data Inspector is maked as RED instead of GREEN when the healthiness criteria is satified. On the other hand, if the data are not loaded the problem is detected at point 2.
- The setup of rate may be wrongly set, and thus a Python process has been setup to perform an analysis of the actual status of the ingested data. The Healthiness control process has been created to perform query on KB through the appropriate API, and obtain the list of not healthy devices, and devices over the expiration time. This information is used to update a table of an SQL database in the platform, or container with SQL database. At each exceution, a number of healthiness metrics is computed in real time to shortening the failure detection and reduce the possibility of proviing alerts for non critical conditions due to sporadic delay of data retrieval.
- An Healthiness Manager reportes the information, and they are dynamically displayed, allowing the user to filter and search for information working on the server side.
- Similar information is accessible from the Data Inspector.
- An IoT App and additional AI/ML processes can be activated on extracted metrics for predicting maintenance, and early warning.
The healthiness data base, for each variable of each device the following information is inserted into the table:
- Service URI of the resource represented by the device
- Proprietary organization of the device, obtained through parsing the URI (if it is not present in the uri it is inserted as NULL)
- Reference broker for the device, obtained through parsing the URI
- device Name obtained through parsing the URI
- Device model (if not specified it is inserted as NULL)
- Nature of the device
- Sub-nature of the device
- Name of the variable/sensor
- Value of the variable/sensor value
- Datetime of the last device measurement received from KB, and thus fully ingested
- Expected date and time of next measurement, according to the device rate
- Number of consecutive failures of the device, indicates for how many consecutive database updates the device was returned as not healthy by the KB API
- Timestamp of the last not healthy, represents the instant of time relating to the last update of the device within the database as not healthy
- Delta: difference in minutes between the time of the last database update and the expected date for the next measurement. It tells us how long the device exceeded theexpected date(if a device returns healthy this parameter may take on a negative value)
- Maximum delta value. It allows us to understand if a device periodically updates the expected date and what is the maximum consecutive not healthy period of the deviceù
- Percent: represents the percentage increase in delta between two consecutive database updates. It allows us to understand the novelty of device failure: a device that has failed for a long time will have a low percentage value while a device that has just become unhealthy will have a high percentage value
- InsertTimestamp: date of the first insertion of the record into the table
When a device is present in the healthiness database results that is already contained in the table, its records are updated with the most recent data returned from the KB. Furthermore, it is checked whether the list of variables already present in the database and those returned by the API match, otherwise a new record is inserted for each new device variable. For each variable of each device already contained in the table the following are updated:
- Number of failures: increased by one compared to the previous value
- Timestamp of the last not healthy
- Date of the next expected measurement
- Date of the last data received
- Value of the variable, if different from the previous one
- Delta and its maximum value
- Percentage of increase in delta compared to the previous value
To reduce the execution times of the code it was necessary to define indexes for the MySQL database, one that takes into consideration only the service uri column and one that indexes by uri and variable name. In this way the recovery of records and therefore the updating of the database is much faster. In fact, the update time for public devices alone without the use of indexes is comparable to that needed for all devices (even private ones) exploiting the potential of indexes.
To prevent the code from throwing an exception when updating records, when the value of delta is 0, and this is to be used in the denominator to calculate the percentage, it is replaced with 1 within the operation; furthermore, percentage values greater than 1000 are set equal to 999, as the database table only accepts floating-point values with at most 3 digits in the integer part of the number.
Moving on to the devices that have returned to healthy, for each of them the KB is queried to obtain some information and thus be able to update the table:
- The number of failures is reset to zero
- The maximum delta value is reset to zero
- The delta increase percentage is set to zero
- The date of the last measurement and the next measurement are updated based on the data returned from the KB
- The delta value is updated considering the new expected date
In reality, given that making a separate request to the KB for each individual device leads to a slowdown in performance, due to the communication overhead between the script and the KB, what is done is grouping these requests and therefore "paginating" them . For each page, a list of 20 service URIs is created and the KB is requested for information relating to only these resources. All this is repeated until the healthy devices run out. This way, the python script has to do slightly more processing, but the number of messages exchanged with the KB, and therefore the overhead, is reduced by about a factor of 20.
Furthermore, in the practical case, it sometimes happens that the KB returns a greater number of results than the expected case of 20 results. This happens when there are devices that have similar service uris, for example in which the case of only some letters changes. In these cases more than one result is returned for these service uris, as the search in the KB is not case-sensitive. When this scenario occurs, the uris of the excess devices that are returned from the KB are printed, so that we can act on these devices later.
However, when a device is searched in the KB to be updated but no result is returned, for example because it has been deleted by its creator, this is highlighted by the code and the name of the device in question is printed, so as to notify that the device can also be deleted from the healthiness database.
The code is made configurable through a fileconfig.json and environment variables. The configuration file consists of a json file with the following attributes:
- CallAPIParams: parameters used to make the call to the KB API
- Page: allows you to manage the size of paged queries to the API. By default, information from 100 devices is retrieved at a time.
- RequestParams: Parameters for the authentication request to obtain the access token
- client id
- client secret
- username
- Password
- ConnectionParams: Parameters to connect to the database
- HostDB: database host, e.g. 192.168.1.53
- UserdDB: username to access the database
- PasswordDB: password to access the database
- DevicesDatabase: Database name
- Table: name of the table used within the database
- Snap4CityDomain: domain used to query the Snap4City KB
- UpdateTime: time the code must sleep before resuming
Similarly in the docker-compose environment variables we find:
- DB HOST: IP address of the machine containing the database
- DB USER: user used to access the database
- DB PW: password used to access the database
- DB DATABASE: database name
- DB TABLE: name of the table
- DB PORT: port used to access the database, must be specified as the database is on a container which must map the original MySQL port on the host, 3306, to the port inside the container
- PAGE DIM: size of paginated queries per KB
- CLIENT ID: client id used for authentication
- CLIENT SECRET: Client secret used for authentication
- REQ USER: username used for authentication
- REQ
PW: password used for authentication - DOMAIN: domain considered for making the request to the KB, e.g. snap4city.org
- SLEEP T
IME: indicates the time in seconds for which the script waits before starting again, for example 300 seconds, or 5 minutes.
Healthiness Manager web page
The front-end of Healthiness Manager consists of a web page that allows you to view part of the records contained in the database in the form of a table. Using Javascript and PHP code, the display is made dynamic and managed mainly on the server side to make the processing performed on the client side by the browser lighter.
Basically, as soon as the page is loaded, the first ten records of the database are shown progressively sorted by number of failures, in decreasing order, then by service URI, in ascending order, and finally by variable name, in alphabetical order. Using a drop-down menu, at the top left of the table, it is possible to choose how many records are displayed at the same time on the page. As it has been programmed, it is possible to select 10, 15, 20, 25 as values and this number of records will be displayed on the page, obviously, unless the number of records, retrieved on the basis of the chosen filters, is lower.
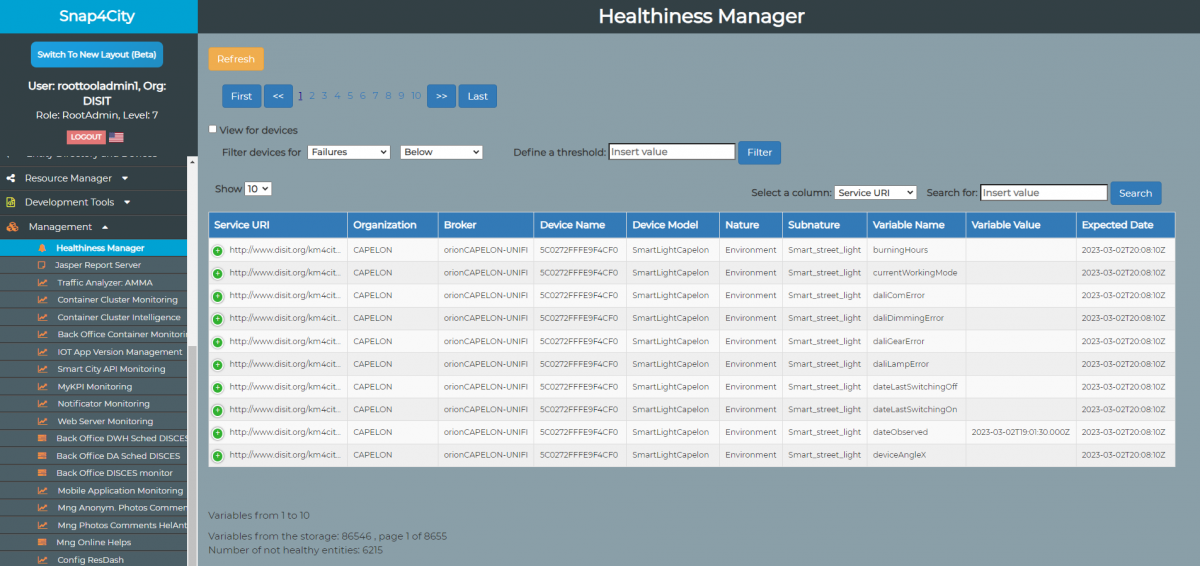
On the web page the records are shown in the same way as they are in the database table (except for the last not healthy date which is converted from timestamp to a UTC date format). By including all the columns they would normally not fit into the page in full and consequently the browser, by default, would display a horizontal scroll bar. For this reason the table is designed to beresponsive, that is, it is able to adapt to the size of the window and dynamically modify the view when it is reduced or enlarged, thus hiding the excess columns, whose values will be visible, via a drop-down menu, by clicking on the first cell of the line. This is achieved by exploiting the features of the Data Table library which provide APIs that allow you to easily manipulate the display of tables also based on user interactions.
As for the records of the devices that have returned healthy, given that in this case the values of the variables are not updated by the Python code seen previously, the background of the respective rows of the table is colored light gray to distinguish them from the correctly updated records relating to the devices currently not healthy.
Basically the records are sorted by decreasing number of failures therefore, moving to the last page of results, the records are shown with a light gray background to remind you that the variable values are not updated.
To better manage the display based on the user's needs, it is possible to sort the results with respect to a specific column of the table. To do this, simply click on the column name at the top and the records will be displayed in ascending order with respect to the values of that column, while by clicking again the records will be displayed in descending order. All this is managed on the server side, in fact each click event on the column, via an AJAX call, causes an SQL query that requests the records from the database in the desired order. In this case, by clicking on the penultimate column shown in the figure, the records are sorted in decreasing order with respect to the number of minutes that have passed since the last healthy.
At the top left of the page there are buttons that allow you to interact with the display and navigate through the results:
- Refresh: allows you to reset all the selected filters and return to the initial view
- Prev (<<): allows you to go to the previous page compared to the one currently displayed
- Next (>>): allows you to move to the next page compared to the one currently displayed
- First: allows you to go to the first page of results based on the current filtering
- Last: allows you to go to the last page of results based on the current filtering
Furthermore, between Prev and Next there will be a series of links to the pages of the table, which will vary dynamically based on the filtering and searches carried out, allowing the user to navigate between the pages more quickly. The pagination is created in such a way as to always show 10 links (if there are fewer pages, the number of links shown will be equal to the total number of pages) whose values change once one of them is clicked. The current page is highlighted, changing the color of the selected link. Similarly, if you click Prev or Next the colored link will move left or right respectively.
It is possible to search for values/strings within the database, selecting one of the columns and specifying what you want to search for. The search is performed serverside by specifying the selected column and value in the query. It is also possible to carry out searches with partial input thanks to the fact that the server-side request is made using the keywordLIKEwithin the SQL query.
In addition, given that the page aims to allow the display of unhealthy devices, it may be useful to filter the results, and therefore the variables, according to their healthiness characteristics. Therefore, the page allows you to filter records by:
- delta value
- maximum delta value
- number of failures
- percentage of delta increase
On the page there is an input that allows the user to enter the threshold of interest and also choose whether to display results that take values above or below this threshold. Once you have made your choice, pressFilterthe first records will be shown based on the selected filtering. Obviously, also in this case as in the previous ones, everything is managed on the server side, in fact when you click to filter an AJAX call is made to a PHP code that makes the appropriate query against the database. Inputs that allow you to select a column to filter records that have values above/below a certain threshold.
------
The code is created in such a way that the various functions can be composed and exploited together, for example:
- I can filter by a certain value and sort the data with respect to one of the columns
- I can search for records that contain a certain string and sort that data with respect to one of the columns
- I can search for data that contains a certain string, filter them according to a certain threshold and sort the results according to the values of a specific column
In this case the records in the table are filtered by selecting only those that have failed more than 100 times. Furthermore, a partial search is carried out with respect to the nature of the devices.
-----
Another option on the page is the one that allows you to switch from the view by variable (the default one) to the view by device. This is achieved simply by an input which if flagged turns into requests to the database which will include the addition of "group by" to group together all the variables of the same service uri (in reality in the practical case aselect distinctspecifying all columns of interest, this was deemed necessary to be compatible with legacy versions of the actual database).
Finally, at the bottom of the page the range of records that are currently displayed is specified, along with the total number of records that match the current filter and the number of corresponding pages, as well as the number of the current page. Furthermore, the total number of devices currently not healthy that are contained in the database is returned (based on the filtering carried out). This is useful for keeping these values under control and to see if there are particular anomalies in the number of unhealthy devices. For example, we could notice if the number of results returned from the KB becomes saturated in some way (for example due to API implementation limits), thus leaving out some devices, or if due to some bad weather or specific phenomenon a considerable quantity of devices has become not healthy. The description tells us which records are currently displayed and how many pages of results the database contains.
Also in this case the code is made configurable using a configuration file and environment variables as in the previous case. Via the fileconfig.phpAndpossible to set:
- database host, e.g. 192.168.1.53
- username to access the database
- password to access the database
- name of the database you want to access
- database table
- port number used to connect to the database
-----
Exploting data of the Healthiness Manager for AI/ML
The data stored into the dynamic database of the healthiness Manager can be accessed via provided API or directly from ODBC, and thus from specific IoT App and Data Analytics processes at level of management to:
- create, smarter healthiness detection models, also based on AI, ML;
- send notifications in real time via email, SMS services, and Telegram, etc.