6.5.1 widgetCurvedLineSeries as Reading widget
First of all, an existing widgetCurvedLineSeries must be identified in the dashboard, of which the id <TARGET_WIDGET_NAME> must be noted.
The JavaScript function to be inserted in the appropriate CK Editor box (in more options) of another widget of the same dashboard, in order to pilot the <TARGET_WIDGET_NAME> widgetCurvedLineSeries is of the following type:
function execute() {
$('body').trigger({
type: "showCurvedLinesFromExternalContent_<TARGET_WIDGET_NAME>",
eventGenerator: $(this),
targetWidget: <TARGET_WIDGET_NAME>,
range: "7/DAY",
field: "vehicleFlow",
passedData: [{"metricId":"https:\/\/servicemap.disit.org\/WebAppGrafo\/api\/v1\/?serviceUri=http:\/\/www.disit.org\/km4city\/resource\/iot\/orionUNIFI\/DISIT\/METRO658&format=json","metricHighLevelType":"Sensor","metricName":"METRO658","smField":"vehicleFlow","serviceUri":"http:\/\/www.disit.org\/km4city\/resource\/iot\/orionUNIFI\/DISIT\/METRO658"}]
});
}
The passedData field can be:
- An array of JSON for the CurvedLineSeries widget, as described in https://www.snap4city.org/drupal/node/575
E.g.:
[{
"metricId": <METRIC_IDENTIFIER_OR_API_REF>,
"metricHighLevelType": <HIGH_LELVE_CLASS_CATEGORY>,
"metricName": <METRIC_NAME>,
"metricType": <METRIC_TYPE>,
"serviceUri": <IOT_DEVICE_SERVICE_URI>,
},
. . .
{
"metricId": <METRIC_IDENTIFIER>,
"metricHighLevelType": <HIGH_LELVE_CLASS_CATEGORY>,
"metricName": <METRIC_NAME>,
"metricType": <METRIC_TYPE>,
"metricValueUnit": <UNIT_OF_MEASURE>,
"meausuredTime": <DATE_TIME_OF_MEASUREMENT>,
"value": [<ARRAY_OF_VALUES>]
}]
An Example:
[{
"metricId": "https:\/\/servicemap.disit.org\/WebAppGrafo\/api\/v1\/?serviceUri=http:\/\/www.disit.org\/km4city\/resource\/iot\/orionUNIFI\/DISIT\/METRO18&format=json",
"metricHighLevelType": "Sensor",
"metricName": "METRO18",
"smField": "vehicleFlow",
"serviceUri": "http:\/\/www.disit.org\/km4city\/resource\/iot\/orionUNIFI\/DISIT\/METRO18"
},
{
"metricId": "",
"metricHighLevelType": "Dynamic",
"metricName": "BatteryTemperatureGalaxyNote",
"smField": "Gradi Centigradi",
"metricValueUnit": "°C",
"values": [
[now-64*base, 19.5],
[now-60*base, 20.0],
[now-56*base, 20.5],
[now-52*base, 18.5],
[now-48*base, 19],
[now-44*base, 18.5],
[now-40*base, 21.5],
[now-36*base, 22.0],
[now-32*base, 19],
[now-28*base, 17.5],
[now-24*base, 16.5],
[now-20*base, 17.0],
[now-16*base, 18.5],
[now-12*base, 20.0],
[now-8*base, 19.5],
[now-4*base, 21.5],
[now-1*base, 21]
]
}]
6.5.2 widgetCurvedLineSeries as Writing widget: Zoom alignment on WidgetCurvedLineSeries
Through a zoom event on a Curved Lines it is possible to send the command to align other Curved Lines, as in the following example:
$('body').trigger({
type: "showCurvedLinesFromExternalContent_w_AggregationSeries_1_widgetCurvedLineSeries70",
eventGenerator: $(this),
targetWidget: "w_AggregationSeries_1_widgetCurvedLineSeries70",
range: "7/DAY",
field: data.smField,
passedData: date,
t1: dt1_iso,
t2: dt2_iso,
event:"zoom"
});
Note that it is necessary to specify the start and end time of the zoom (found in param) and the characterizing event "zoom", in this case the passedData, event and fields parameters are not necessary since the receiving Curved Lines will maintain the same metric present before the zoom.
6.5.3 widgetCurvedLineSeries as Writing widget: Temporal Drill-Down by Zoom on WidgetCurvedLineSeries
At the time zoom event on a curve lines, the execute function is executed inside the relative ckeditor in which a JSON object called param is passed in which there are start and end times and an array that presents all the metrics that the widget is showing, within each element there are the characteristics of the device and the identified metric. Param has the following form:
{
"t1":1677060516253.012,
"t2":1677063881726.334,
"series":[{
"metricId":"https://servicemap.disit.org/WebAppGrafo/api/v1/?serviceUri=http://www.disit.org/km4city/resource/iot/orionUNIFI/DISIT/M...",
"metricHighLevelType":"IoT Device Variable",
"metricName":"DISIT:orionUNIFI:METRO1",
"smField":"concentration", "serviceUri":"http://www.disit.org/km4city/resource/iot/orionUNIFI/DISIT/METRO1"
}]
}
The following example shows how to use this input parameter to calculate the average of the metrics present in the device and send this data to a Bar Series to be displayed:
function execute() {
var newParam = {};
newParam.t1 = param['t1'];
newParam.t2 = param['t2'];
newParam.metricName = param.series[0].smField;
newParam.sUri = param.series[0].serviceUri;
param = newParam;
let minT, maxT = null;
if (param['t1'] != param['t2']) {
minT = param['t1'];
maxT = param['t2'];
}
else {
minT = param['t1']-10000000;
maxT = param['t2']+10000000;
}
let dt1 = new Date(minT);
let dt1_iso = dt1.toISOString().split(".")[0];
let dt2 = new Date(maxT);
let dt2_iso = dt2.toISOString().split(".")[0];
function getMean(originalData){
var singleOriginalData, singleData, convertedDate = null;
var convertedData = {
data: []
};
var originalDataWithNoTime = 0;
var originalDataNotNumeric = 0;
var meanDataObj = {};
if(originalData.hasOwnProperty("realtime")){
if(originalData.realtime.hasOwnProperty("results")){
if(originalData.realtime.results.hasOwnProperty("bindings")){
if(originalData.realtime.results.bindings.length > 0){
let propertyJson = "";
if(originalData.hasOwnProperty("BusStop")){
propertyJson = originalData.BusStop;
}
else{
if(originalData.hasOwnProperty("Sensor")){
propertyJson = originalData.Sensor;
}
else{
if(originalData.hasOwnProperty("Service")){
propertyJson = originalData.Service;
}
else{
propertyJson = originalData.Services;
}
}
}
for(var j = 0; j < originalData.realtime.head.vars.length; j++){
var singleObj = {}
var field = originalData.realtime.head.vars[j];
var numericCount = 0;
var sum = 0;
var mean = 0;
if (field == "updating" || field == "measuredTime" || field == "instantTime" || field == "dateObserved") {
continue;
}
for (var i = 0; i < originalData.realtime.results.bindings.length; i++) {
singleOriginalData = originalData.realtime.results.bindings[i];
if (singleOriginalData[field] !== undefined) {
if (!isNaN(parseFloat(singleOriginalData[field].value))) {
numericCount++;
sum = sum + parseFloat(singleOriginalData[field].value);
}
}
}
mean = sum / numericCount;
meanDataObj[field] = mean;
}
return meanDataObj;
} else {
return false;
}
} else {
return false;
}
} else {
return false;
}
} else {
return false;
}
}
function buildDynamicData(data, measuredTime) {
var passedJson = [];
for (const item in data) {
var singleJson = {};
singleJson["metricId"] = "";
singleJson["metricHighLevelType"] = "Dynamic";
singleJson["metricName"] = name;
singleJson["metricType"] = item;
singleJson["metricValueUnit"] = "";
singleJson["measuredTime"] = measuredTime;
singleJson["value"] = data[item];
passedJson.push(singleJson)
}
return passedJson;
}
$.ajax({
url: "../controllers/superservicemapProxy.php/api/v1/?serviceUri=" + encodeServiceUri(param['sUri']) + "&fromTime=" + dt1_iso + "&toTime=" + dt2_iso,
// url: "../controllers/superservicemapProxy.php/api/v1/?serviceUri=" + encodeServiceUri(sUri) + "&fromTime=" + dt1_iso + "&toTime=" + dt2_iso + "&valueName=" + param['metricName'],
type: "GET",
data: {},
async: true,
dataType: 'json',
success: function(data){
if (data.realtime.results) {
var meanData = getMean(data);
var passedJson = buildDynamicData(meanData, data.Service.features[0].properties.name, data.realtime.results.bindings[0].measuredTime );
$('body').trigger({
type: "showBarSeriesFromExternalContent_w_AggregationSeries_1_widgetBarSeries48",
eventGenerator: $(this),
targetWidget: "w_AggregationSeries_1_widgetBarSeries48",
passedData: passedJson
});
} else {
$('#w_AggregationSeries_1_widgetBarSeries48_chartContainer').hide();
$('#w_AggregationSeries_1_widgetBarSeries48_noDataAlert').show();
}
},
error: function (data){
console.log("Errore in scaricamento dati da Service Map");
console.log(JSON.stringify(data));
}
});
}
6.5.4 widgetCurvedLines providing status from legend
widgetCurvedLines also allows you to output data relating to the active or deactivated status of the metrics to another widget by clicking on the legend of the graph.
This is done by placing a JavaScript execute function in the CKEditor code. As in the example below.
function execute(){
$('body').trigger({
type: "showSingleContentFromExternalContent_w_DISIT_orionUNIFI_METRO1_1536_widgetSingleContent9999",
targetWidget: "w_DISIT_orionUNIFI_METRO1_1536_widgetSingleContent9999",
widgetTitle: "Show legend status",
passedData: { 'dataOperation': param}
});
}
"param" in this case is a fixed variable which is used to send the data from the graph, it is not customizable by the user.
To activate this function, click on a label in the graph legend.
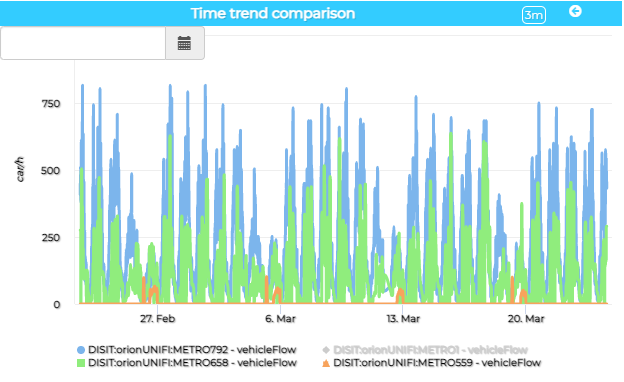
The Curved Lines widget will send as output a json with a list of metrics associated with the visible status true/false and a list of temporal data visible in the graph.
{ "event":"legendItemClick",
"layers":[ {
"name":"DISIT:orionUNIFI:METRO792 - vehicleFlow",
"visible":true
}, {
"name":"DISIT:orionUNIFI:METRO1 - vehicleFlow",
"visible":false
}, {
"name":"DISIT:orionUNIFI:METRO658 - vehicleFlow",
"visible":true
},{
"name":"DISIT:orionUNIFI:METRO559 - vehicleFlow",
"visible":true
}], "metrics":[1677069000000,1677069900000,1677070800000,1677078900000,1677079800000, 1677080700000,1677081600000, 1677082500000, 1677083400000, 1677084300000, 1677085200000,1677086100000,1677087000000,1677090600000, 1677091500000, 1677092400000,1677093300000,1677094200000,1677095100000]}
6.5.5 widgetCurvedLines reset zoom
In addition to commanding a zoom to one or more widgets (5.5.2), widgetCurvedLines can also reset the zoom of these widgets.
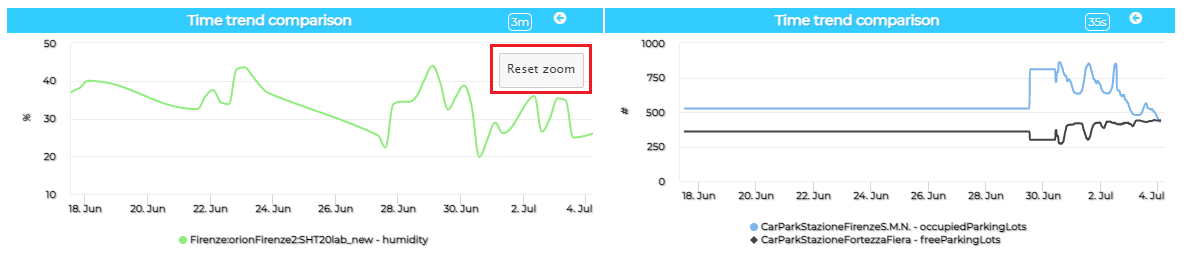
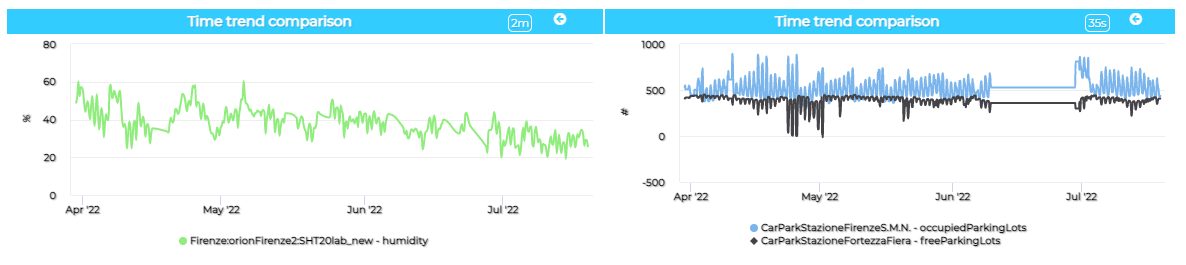
By clicking on the "Reset zoom" button, you can send a command to the other widgets to reset the magnification of the other widgets.
This operation is performed using the execute() function present in the CkEditor by sending parameters present in the following code.
{
"event":"reset zoom",
"t1":null,
"t2":null,
"series":[
{ "metricId":"https://servicemap.disit.org/WebAppGrafo/api/v1/?serviceUri=http://www.disit.org/km4city/resource/CarParkStazioneFirenze...",
"metricHighLevelType":"Sensor",
"metricName":"CarParkStazioneFirenzeS.M.N.",
"smField":"occupiedParkingLots", "serviceUri":"http://www.disit.org/km4city/resource/CarParkStazioneFirenzeS.M.N."
}
]
}
The structure of the "reset zoom" message is similar to that of zoom, however the t1 and t2 keys are set to null to cancel filtering on widget target dates.
The user can then use these parameters to decide how to handle the zoom reset in the various widgets. By default this operation acts on target widgets in which a zoom event has been defined in the ckeditor code.
function execute(){
let dt1 = new Date(param['t1']);
let dt1_iso = dt1.toISOString().split(".")[0];
let dt2 = new Date(param['t2']);
let dt2_iso = dt2.toISOString().split(".")[0];
$('body').trigger({
type: "showCurvedLinesFromExternalContent_w_AggregationSeries_3545_widgetCurvedLineSeries35689",
eventGenerator: $(this),
targetWidget: "w_AggregationSeries_3545_widgetCurvedLineSeries35689",
range: "7/DAY",
color1: "#9b93ed",
color2: "#231d5c",
widgetTitle: "Example",
t1: dt1_iso,
t2: dt2_iso,
event:param['event'];
});
}
For example, in this case in the ckeditor js code the target widget is "w_AggregationSeries_3545_widgetCurvedLineSeries35689", consequently zooming and resetting the zoom will only affect this widget.
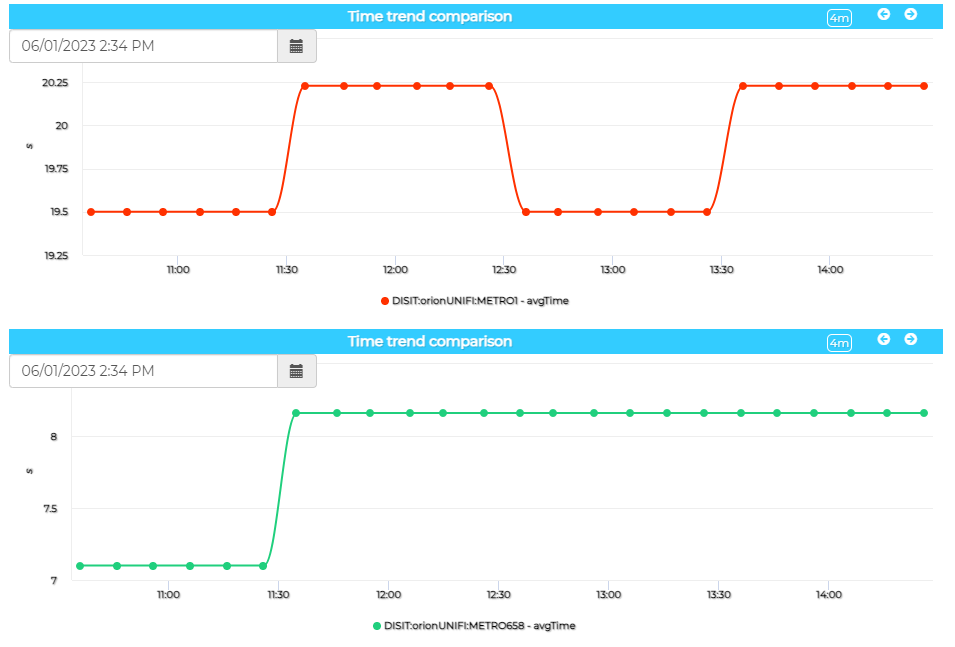
6.5.6 WidgetCurvedLine Time Selection
Widget CurvedLine also allows you to send a date and time parameter as input to another widget to insert in the calendar. In this way it is possible to synchronize more than one widget at the same moment in time.
For example, if in a dashboard there are two CurvedLine widgets with different data and I want them to always show data relating to the same moment in time, I can activate this feature so that when I use the calendar in one of the two, the other is also changed.
This feature is activated when you edit the calendar. The following parameters must be set in the execute() function of the widget writer:
event: "set_time"
It is an important parameter because it is used to activate the synchronization function. It doesn't work without it.
datetime: param
This parameter must receive the date of the datetime automatically from the selection of the Calendar.
passedData: []
Usually when writing the CurvedLine widget it is possible to send a list of elements to the target widget, in the case of the selectionTime this parameter can be represented as an empty array. However, it must be present for the feature to work properly.
function execute() {
$('body').trigger({
type: "showCurvedLinesFromExternalContent_w_AggregationSeries_1542_widgetCurvedLineSeries10065",
targetWidget: "w_AggregationSeries_1542_widgetCurvedLineSeries10065",
widgetTitle: "Curved Lined Report",
event: "set_time",
datetime: param,
passedData: []
});
}