The Dashboards are composed by widgets. Each widget may represent several data and has a specific graphic representation and user interaction. Before stating the design of the user interface, you have to know the capabilities of the Snap4City Dashboards which are very wide providing almost any kind of widgets and graphic representation for your data, and relationships among them to create not only good representations but also a good interaction design, to specific what is going to happen interacting with the graphic elements and data on your user interface.
In Snap4City, there is a specific tutorial for the Dashboard development with several examples and the full list of capabilities in SLIDES: https://www.snap4city.org/download/video/course/das/.
- are the main components of the Dashboards.
- can be created/edited from the Dashboard Builder, resized, placed, changed in color, etc.
- can be configured to perform a periodic refresh of their data recollecting them from storage/API.
- can be created/connected to Proc.Logic / IoT App.
- can be event driven, so that they are capable to update their data without forcing any refresh to they data.
- can collected interaction from the user to send them on Client-/Server-Side Business Logic.
- can be controlled by other widgets.
- can be controlled by the Proc.Logic / IoT App which can command the widget to show specific data from the storage, specific values, etc., and their combinations (Server-Side Business Logic).
- can be controlled by the Client-Side Business Logic in JavaScript coded in other on in the same widget to send/receive command to show specific data from the storage, specific values, etc., and their combinations, and also some computation, etc.
- etc.
The dashboards can be classified into
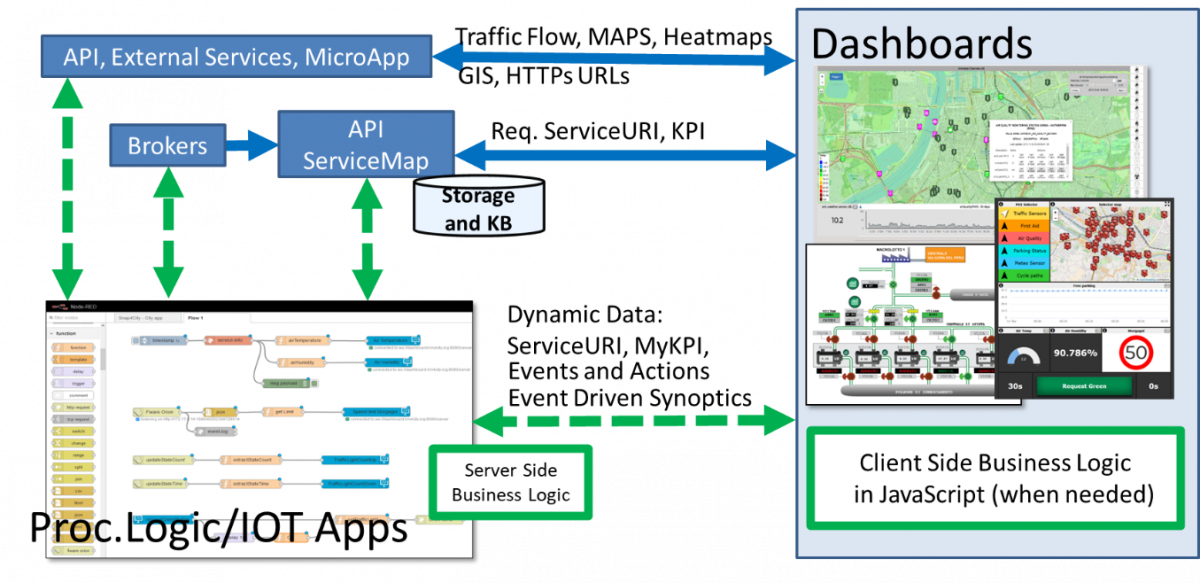
- Passive Dashboards: showing data taken from Storage only, no actions toward Processing Logic (IoT App) node-RED neither on custom JavaScript (ONLY BLUE ARROWs in the above figure):
- Passive dashboards may have widgets of any kind, and a lot of visualization tools without changing the status of Entities on platform, nor sending commands to the Server Side.
- Passive dashboards are used to creates rendering views of the data in the storage and event driven from their changes with some limited logic pre-coded in the dashboard. For example, a Dashboard with a map and a menu from which the user may decide what is going to be visualized in the page, to browse the data, and see the historical time trend of the time series, etc.
- Active Dashboards, are those that show that from the storage and in addition send/receive commands to/from the logic coded somehow (BLUE and GREEN ARROWS in the above figure) and in particular for
- Server-Side Business Logic à logic on Processing Logic (IoT Apps) with Snap4City Dashboard Nodes, which is easier to be programmed begin based on Node-RED visual programming.
- Client-Side Business Logic à logic on JavaScript on specific Dashboard Widgets only for authorized Area Managers developers of Snap4City Platforms. We suggest first prototype by using Server-Side Business Logic, then pass to Client-Side Business Logic in JavaScript. Client-Side Business Logic is coded into the Widgets providing events via the Dashboard Builder in Editing Mode. Client-Side Business Logic may exploit a large number of events provoked by the user on the Dashboard Widgets. A specific user manual will be accessible soon, in addition to what is published on web pages.
- Both kinds of Business Logics may be active on the same Active Dashboard.
The Active Dashboards are used to implement Business Intelligence solutions with high interactivity and the possibility of changing the data and the representation of data on the Dashboard dynamically on the basis of the user actions. Examples are:
- the click on some button or widget on Dashboard to activate a computation on Client/Server side. The computation on server side can include the activation of complex Data Analytics to be shown as a result on the same or other dashboard as event drive actions.
- To select some data and perform a query showing them on map and barseries, pie, multi-trend, etc.
- To move a slider and see the light on dashboard changing.
- To filter data from a certain time windows and see the changes also on other data representations.
- Select a time period on a time series and see all the other time trends aligned to the same period.
- Select a PIN on map and see a barseries proving last year average data regarding that element.
- Etc.