This dashboard has been created to provide an instrument to City Officers and Experts about environmental and weather aspects of the city. The users can pass from the overview to see the value and trends of specific data and piking values in GPS points of the map as he/she prefers. The dashboad has been produced by Snap4City team, you can find more and more information on Https//www.snap4city.org
Dashboard Link: https://www.snap4city.org/dashboardSmartCity/view/index.php?iddasboard=MTQwNw==
Please read https://www.snap4city.org/drupal/node/435 for the definitions of the measured and computed values.
On the left you can select to see on map:
- Cultural Activity: PINs about cultural activities in the area. When you select a PIN the information about the cultural activity (details and description) can be visualized.
- Entertainment: PINs about entertainment locations in the area. When you select a PIN the information about the entertainment location (details and description) can be visualized.
- Tourism Services: PINs about tourism services location in the area. When you select a PIN the information about the tourism service (details and description) can be visualized.
- Education & Research: PINs about education and research centers in the area. When you select a PIN the information about the education and research centers (details and description) can be visualized.
- Government Offices: PINs about government offices location in the area. When you select a PIN the information about the government office (details and description) can be visualized.
- Accommodation services: PINs about accomodations location in the area. When you select a PIN the information about the accomodation (details and description) can be visualized.
- Air Quality Sensors: PINs about the location of air quality sensors (see below for what you can do on the pin for showing data, and drill down on the several data associated with sensors).
- Weather Sensosr: PINs about the location of weather sensors (see below for what you can do on the pin for showing data, and drill down on the several data associated with sensors).
- Air Temperature heatmap: real time heatmap of the air temperature in the Antwerp area. The map is upgraded every 2 hours.
- Humidity Heatmap: real time heatmap of the air humidity in the Antwerp area. The map is upgraded every 2 hours.
- NO heatmap: real time heatmap of pollutant levels in air in terms of nitric oxide (NO measured in µg/m3) particles in the Antwerp area. The map is upgraded every 2 hours.
- NO2 heatmap: real time heatmap of pollutant levels in air in terms of nitrogen dioxide (NO2 measured in in µg/m3) in the Antwerp area. The map is upgraded every 2 hours.
- PM10 heatmap: real time heatmap of pollutant levels in air in terms of PM10 (measured in µg/m3) particles in the Antwerp area. The map is upgraded every 2 hours.
- PM2.5 heatmap: real time heatmap of pollutant levels in air in terms of PM2.5 (measured in µg/m3) particles in the Antwerp area. The map is upgraded every 2 hours.
- SO2 heatmap: real time heatmap of pollutant levels in air in terms of sulphur dioxide (SO2 measured in µg/m3) particles in the Antwerp area. The map is upgraded every 2 hours.
- O3 heatmap: real time heatmap of pollutant levels in air in terms of ground-level ozone (O3 measured in µg/m3) in the Antwerp area. The map is upgraded every 2 hours .
- EAQI: real time heatmap of European Air Quality Index. The resulting index from 1 to 5 indicate the quality of air.
- CAQI: real time heatmap of Common Air Quality Index. The index is defined away from roads (a "background" index). CAQI is computed on the basis of NO2, PM10 ,O3 and PM2.5.
- Biking Safe Heatmap: heatmap representing the safety levels for bikes (7 levels from very bad to excellent) in the Central Antwerp area according to the positive or negative feelings of citizens. The map is static and related to the 2018.
- Tunnels and Ferry: PINs about Tunnels and Ferry position in the area. When you select a PIN the information about the tunnel or the ferry (details and description) can be visualized.
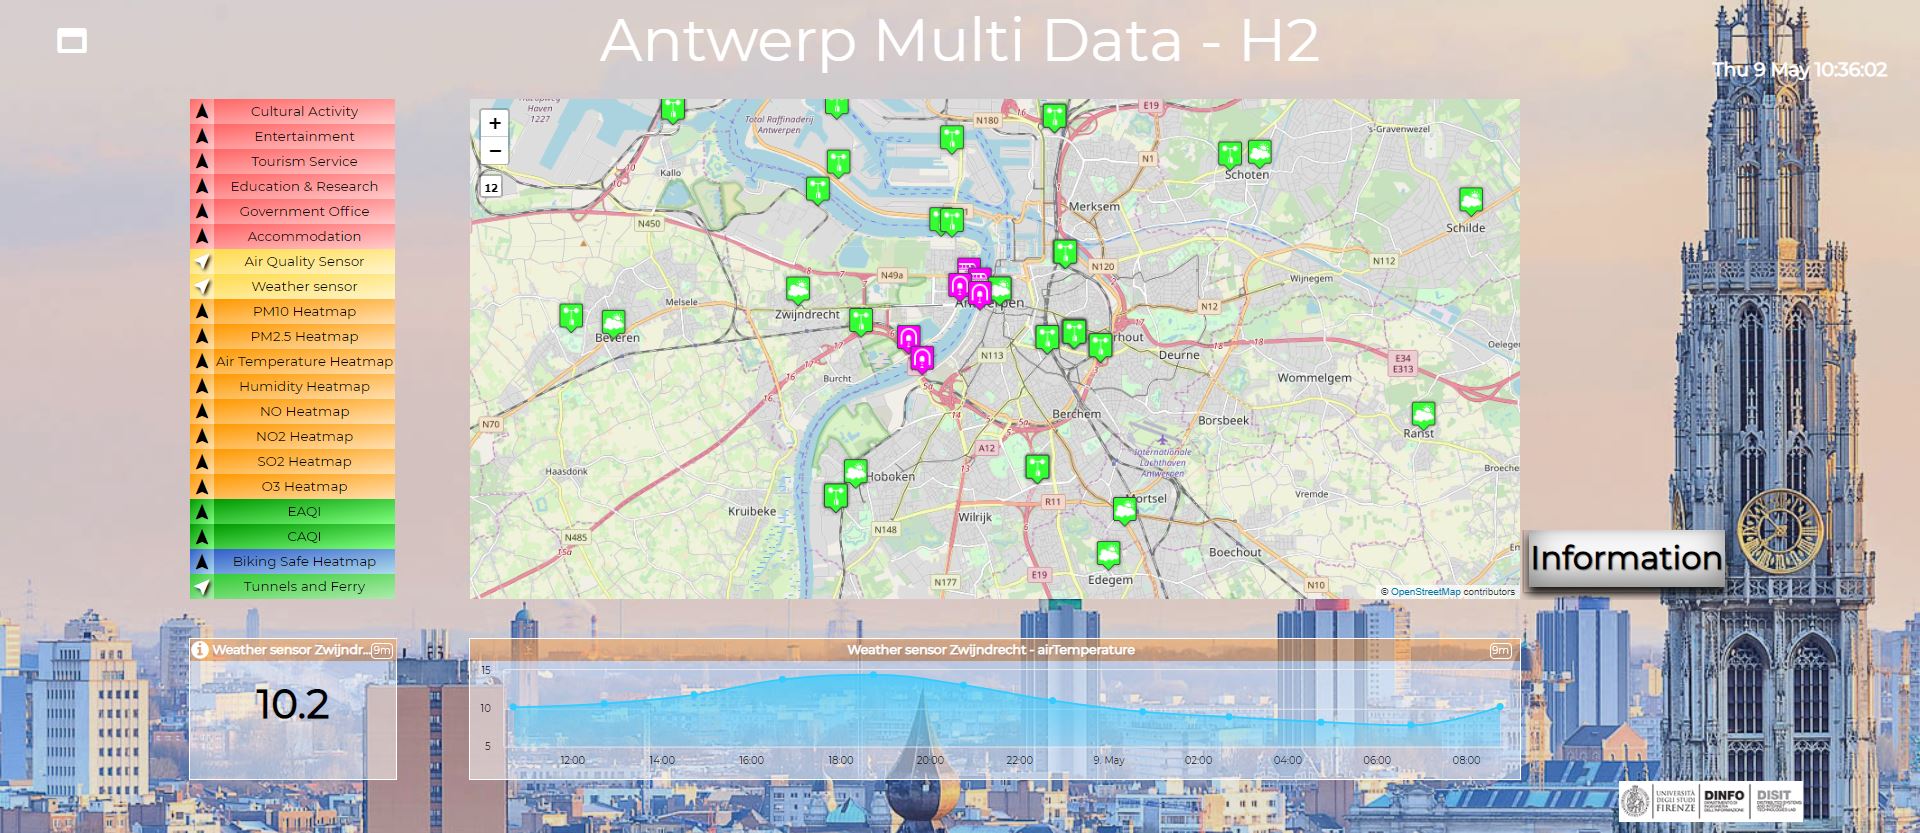
Below the Selector on the left you can see:
- A single value referring to the real time air temperature of: Weather sensor Zwijndrecht. On this widget other values can be shown once identified them on the PIN of the Map. For example the messages of the Tunnels, the real time values of the sensors, etc.
Forum Discussion on the right side:
- a Forum for collecting comments, requests to improve and discussion open among the users of the dashboard.
On the Map, several information may appear:
- PINs about points of interests where you can select a PIN to see information
- Name
- Description
- Details (Location and Address)
- PINs about sensors where you can select a PIN to see information
- Details
- Description
- Real Time data: clicking on one of the buttons under the heading "Buttons" (Last Value, Last 4 hours etc.) the trend below the map change in according to the selected sensor (the name of each measred sensors can be found under the heading "Description"). The heading "Value" indicates the realt time measuring for each sensors description (according to the last update).
- Heatmap Information pop up when you click on a point of the map
- Description (Date & Time, Metric Name, Heatmap Value, Coordinates)
- Value (please note that the value could have been produced by interpolation or prediction according to the model that you are observing)
- Heatmap Controls widget positioned at the top right of the map with the name of the Heatmap
- Opacity: the slider that can be used to correct the opacity of the map
- "Next" and "Prev": the buttons can be used to display maps related to different date and times
- Animation: the swich "24H" to make the animation of the heatmaps related to the previous 24 hours
- the legenda of the heatmap color is positioned at the bottom left of the map
Below the Map:
- The initial trend value is referring to air temperature of: Weather sensor Zwijndrecht
- both single value and trends are used to visualize the data selected on the PIN that you may select on the map, see above
The data of this dashboard have been collected by Snap4City according to the PCP lanched by Select4Cities project.
The data sources used for creating this dashboard are listed in the following web pages:
Helsinki: https://www.snap4city.org/drupal/node/364
Antwerp: https://www.snap4city.org/drupal/node/363
 European Commission Affiliation Select4Cities project has received funding from the European Union’s Horizon 2020 research and innovation programme under grant agreement No 688196. Please note that this website represents the view of Snap4City, with the support of Select4Cities project and that the Commission is not responsible for any use that may be made of the information it contains.