Hardware
In order to experiment the full potential of the SCDT, we suggest using the Google Chrome web browser on a workstation equipped with an Intel Core i9-12900K@3.20 GHz, with 32GB of RAM, and an NVIDIA RTX A4500 GPU (the same configuration used to carry out the performance tests) or a superior configuration. In the case a user does not have access to such a configuration, our SCDT also works quite well with lighter hardware: using reduced settings the user can be used to still be able to test the SCDT without experimenting sluggishness (see the following for a description of how to set the preferred parameters).
Interface main components
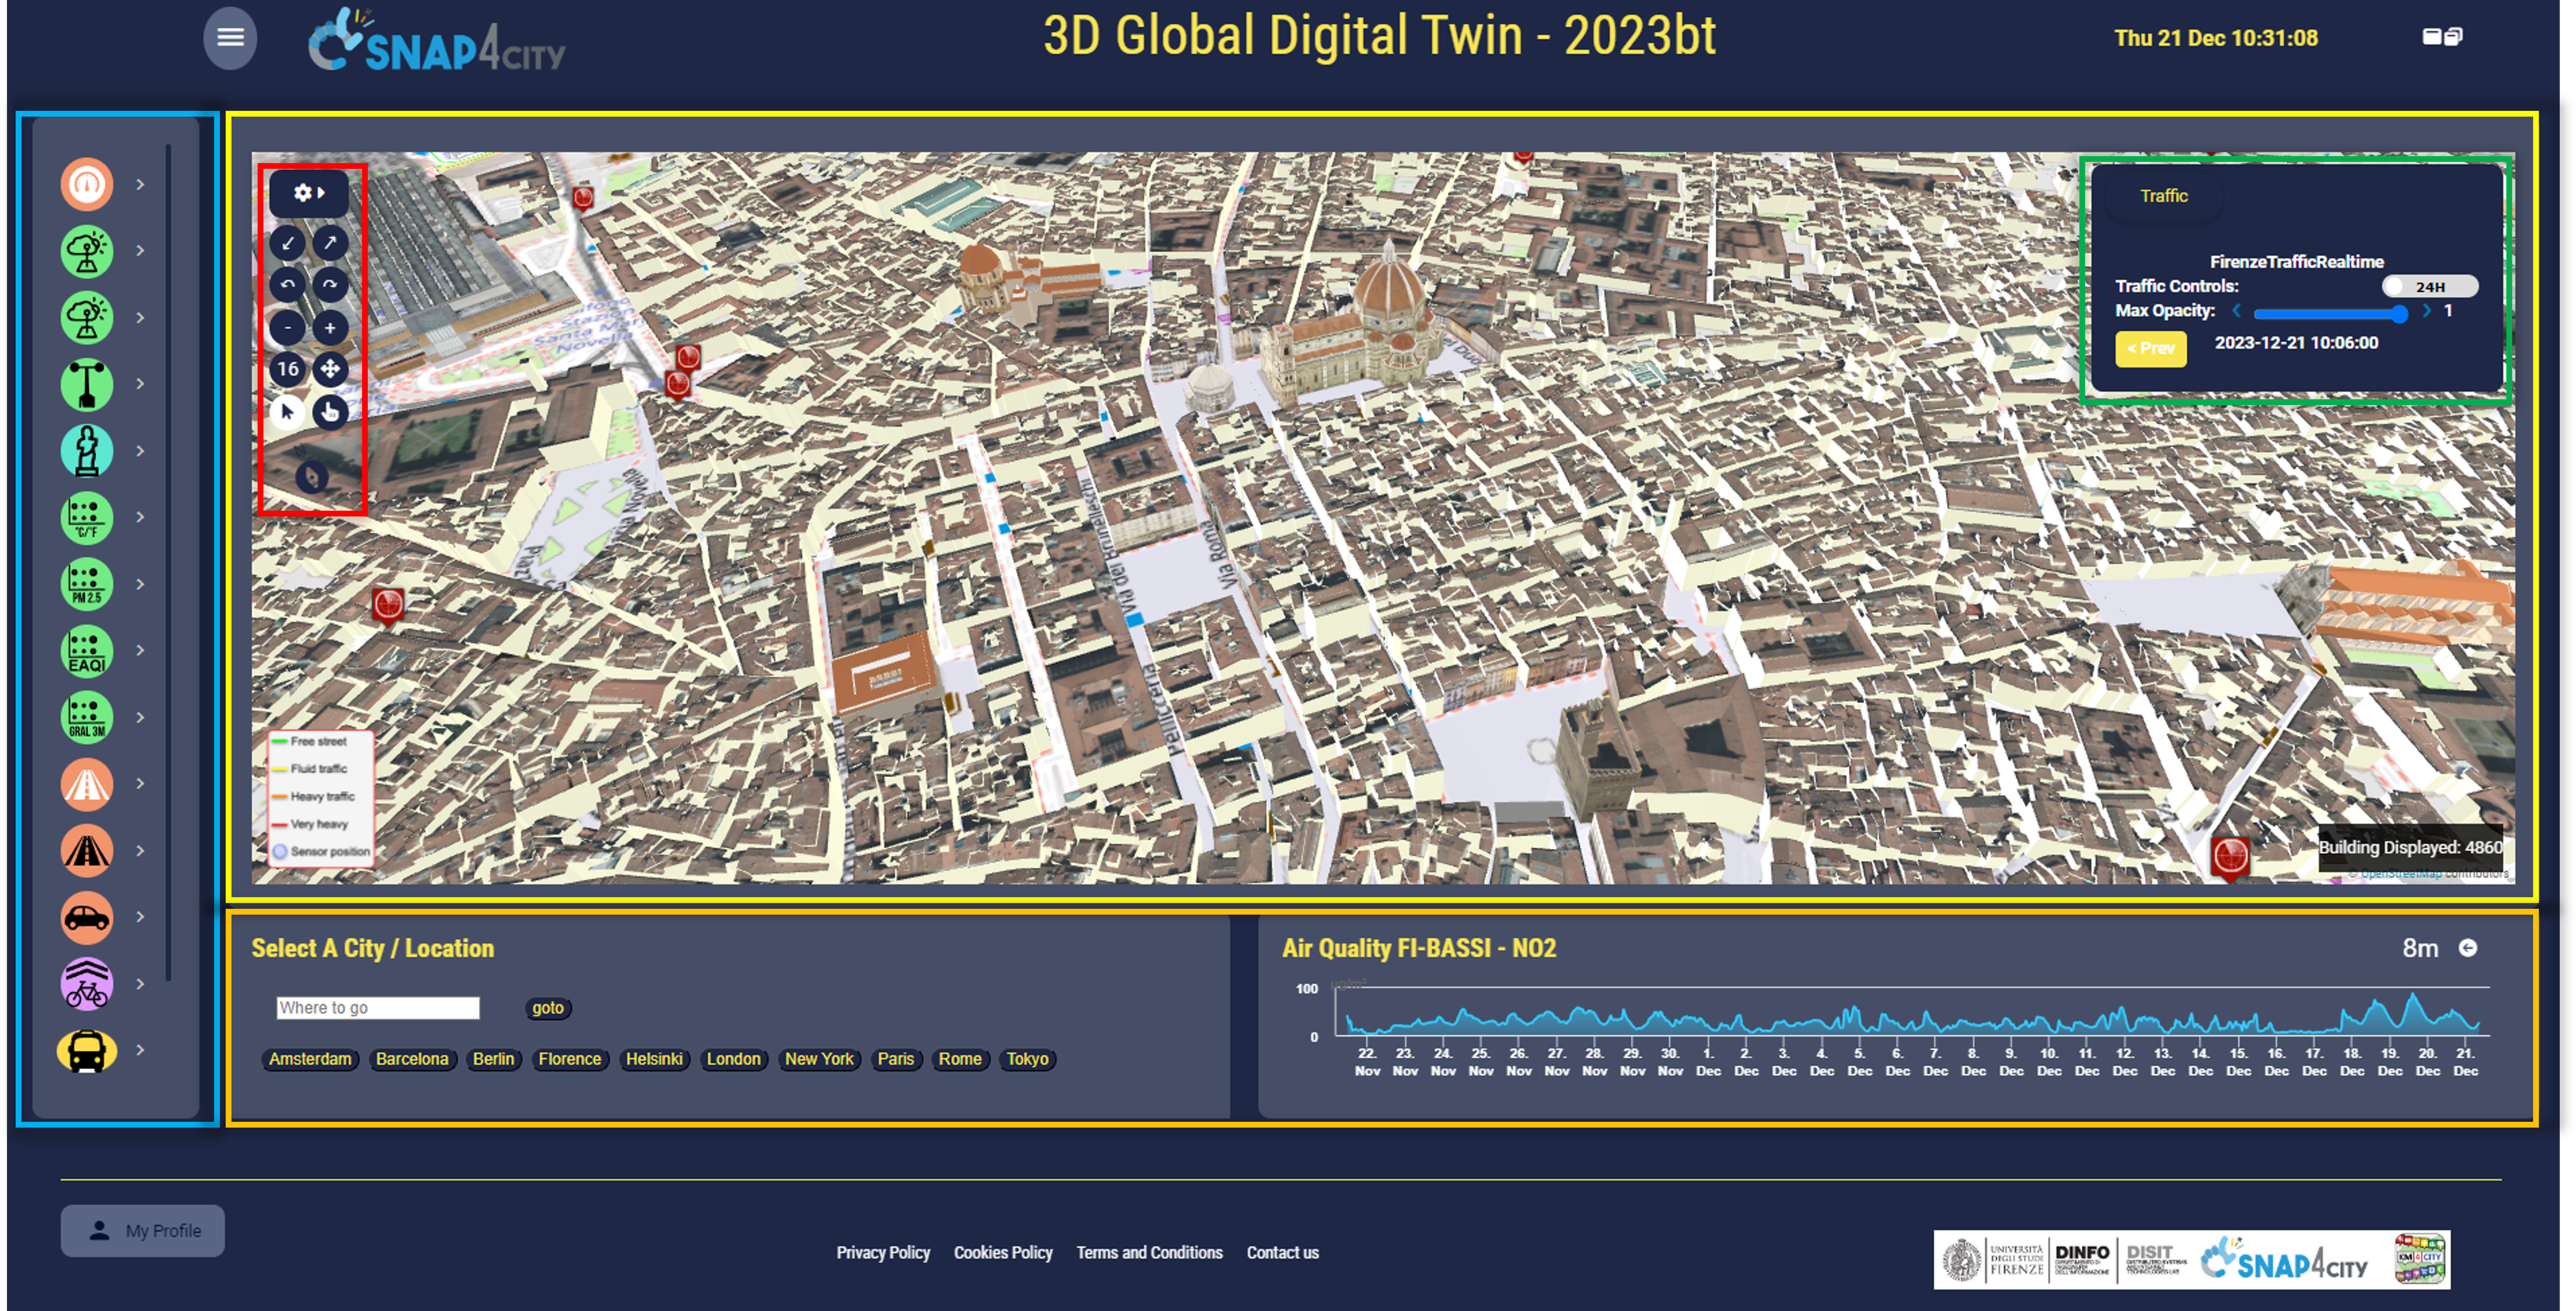
Main SCDT web interface: the dashboard is presented with LoD3 and HVB models shown together with PINs, 3D animated arrows for traffic, heatmaps, 3D Cylinders, trees. The blue rectangle highlitgh the selector menu. In yellow the main 3D multi-data map, with the in-map menu (red rectablge) and the interactive pannel (green rectangle). Under the map, in the orange rectangle, addional widget can be visualized.
As can be seen in the figure above, on the left side, a selector bar can be used to activate/disactivate different kind of data (PINs for IoT sensors, POIs, and bus stops, multiple heatmaps, traffic information as heatmap or 3D crests/arrows, cycling paths, 3D columns, and What-If analysis). Each icon provides the specific data name by mouse over, and for some of the available data a panel is shown in the top-right corner of the main map where additional information and controls are provided for the specific layer. In the main portion of the dashboard the 3D multidata maps is presented. Into the map, on the top-left corner, an in-map menu is provided with buttons to control rotation, tilt, and zoom movements. Additionally, the cross-like button can be used to put the map at full screen, while the arrow and hand button can be used toggle the building picking modality on buildings shown in the map to get detailed information, to change the displayed 3D model, and to access to a BIM representation when available. Finally, the compass button can be used to orientate the map with the north direction pointing upward. By clicking on the gear icon, a sub-menu is shown with the following fields: Orthomaps, that can be used to change the orthomap displayed over the terrain, Buildings, to select which kind of building have to be rendered in the map, and Settings, where the user can specify different parameter to optimize its user experience according to the client hardware and activating/disactivating specific data.
In the bottom part of the dashboard additional widgets are included. On the left side, the Select a City/Location widget can be used to navigate in different locations worldwide by clicking on the predefined cities or by inserting a specific location. This is particularly useful when using the Google 3D tiles that have a wide coverage. On the right side, a timeseries widget is included. This widget can be used to show time evolution of specific measurements of a selected IoT device: the used, after activating a device kind using the button in the selector menu, can click on a PIN, select the RT DATA tab in the shown pop-up, and then click on one of the options under the Buttons column (i.e., 4h, 24h, 7d, 30d, 6m, 1y). Such an action provokes a client-side business logic callback that is catch by the widget that will show the timeseries for the requested period.
Settings
The Settings panel gives the user the possibility to set the following parameters:
< >Max number of tiles: this number indicates the maximum number of building tiles to be displayed in the map. By increasing the value more buildings are shown, requiring higher CPU and GPU loads. Conversely, reducing the value, less buildings are rendered, easing the SCDT usage with low-end clients.
Min 3D zoom: the minimum zoom value for displaying the 3D buildings. If the zoom value is inferior of such value no buildings are rendered in the map.
Traffic Animation Enabled: if checked, the 3D animated arrows are used to display traffic information. Otherwise, the less resource demanding static 3D crests are used.
Arrow size(m): this value specifies the 3D arrow dimensions. This value indirectly impacts on the apparent arrow animation speed.
Height crest layer(m): this value specifies the height of the 3D arrows and the 3D crests used to represent the traffic.
Display road information: if checked, the road graph is requested from the KM4City knowledge base and displayed over the terrain.
Display decorations: if checked, additional 3D elements (trees and airplanes at the airport) are shown in the map. The Min 3D zoom impacts also on this 3D elements.
Realistic decoration: if checked, the more realistic 3D trees models (that requires additional resources) are shown in the map. This setting works only if the Display decoration is active.
After setting the appropriate values, by clicking the Save button the changes are applied into the map without requiring any page reload.