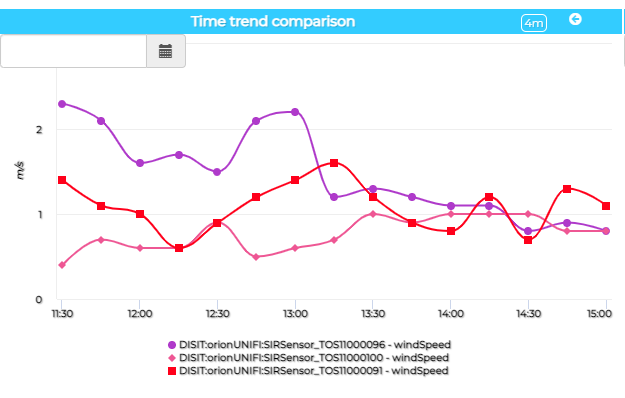
The Curved Lines Series widget displays a timeline based on a time range, definable from the edit menu in editing mode, which has by default the date and time of the last metric detection as the graph's last point.
Through the calendar functionality it is possible to define the date and time of the graph's last point. The graph will be recalculated on the basis of the current time range.
For example, if the dashboard is displayed on May 1st 2023 at 10.00 and the time range set is one month, the graph will show the data from 04/01/2023 10:00 to 05/01/2023 10:00.
If we set the datetime picker to 1 February 2023 at 12:00, keeping the same time range, the graph will automatically be recalculated with the data from 01/01/2023 12:00 to 02/01/2023 12:00.
it is also possible to change the time range while keeping the new set datetimepicker final point.
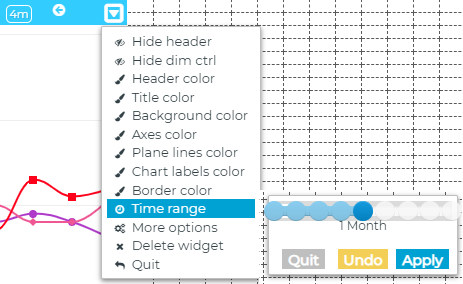
The functionality of activating and deactivating the datetime input can be done through the more options menu accessible in the editing mode of the dashboard, at the input selection Show Calendar Button.