For each Dashboard or View we suggest specifying:
|
Name |
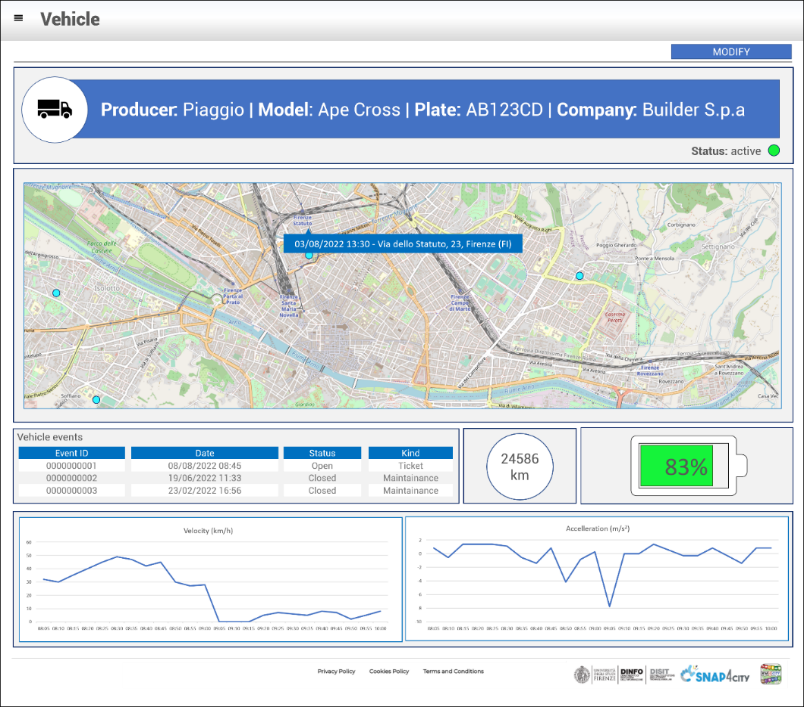
Vehicle dashboard |
|
|
|
|
Aim |
Display vehicle information and measured values |
|
Purpose |
Monitoring |
|
Status |
Draft |
|
Missing |
None |
|
Preferred size |
PC |
|
Style |
PA |
|
Chat enabled |
No |
|
Kind |
Active |
|
Data vs Widget |
Map Widget
DataTable Widget
SingleContent Widget
Time series Widget
|
|
Client-Side Business Logic |
To be developed in JavaScript into the Dashboard Widget
|
|
Server-Side Business Logic |
To be developed in Processing Logic / IoT App with S4C Dashboard Nodes
|
As can be seen in the example dashboard schema above, several information must be specified:
- Name: name or ID of the dashboard
- Mockup: a graphical example showing the overall appearance of the dashboard. This can be realized using some graphic painting tool (a screenshot of an empty dashboard can be used as background element)
- Aim: a description of the dashboard
- Purpose: it can be monitoring, simulation, what-if, data entry, etc. Multiple values are possible.
- Status: it can be draft, developed, finalized, accepted
- Missing: in this field list all missing element that should be included in future
- Preferred Size: specify the preferred viewing size of the dashboard, such as PC, HD, mobile, or an explicit resolution size (row x column)
- Style: the base style to be used for the dashboard. Available styles include Gea, Balloon, PA, Balloon Dark, etc.
- Chat enabled: yes or no
- Kind: passive or active. A passive dashboard show data taken from storage only, without sending actions toward an IoT App; however, passive dashboards may have selectors, maps, etc., and a lot of interactive visualization that do not requires neither changes in the status on server, nor sending commands to the server side. Differently, active dashboards, are those that send or receive commands to/from the server side, via some client-side Business Logic, server-side Business Logic on Processing Logic / IoT Apps, or both.
- Data vs Widget: for each widget required in the dashboard, some information must be specified according to the following schema:
- Name: the name of the widget to be used
- Description: a brief description of the widget and its use
- Kind: monitoring, Processing Logic / IoT App, or Client-Side business logic (note that, the last two entries characterize an active dashboard)
- Data: the data the be used in the widget, typically retrieved from some Entity Instance (IoT device). Multiple entries can be accepted.
- Client-Side Business Logic: to be specified if present
- Description of the effects: a description of the implemented client-side business logic effects
- Server-Side Business Logic: to be specified if present
- IoT App: description of the involved Processing Logic / IoT App
- Event driven indicates to which events the Processing Logic / IoT App responds.