The Snap4D3 node is a component of the Snap4City IOT architecture for Node-RED to use D3.js graphic library (https://d3js.org/) widgets on Snap4City Dashboards. The new functionality is available as Node-RED node in the Snap4City library, as explained below.
see D3.JS large gallery of different widgets: https://observablehq.com/@d3/gallery
Any D3.JS graphics can be produced from IOT App, Node-RED and sent to Snap4City Dashboard via a protected channel. Actions of the user are returned back to the Node-red/IOT App on Snap4City
SEE EXAMPLE ON https://www.snap4city.org/dashboardSmartCity/view/index.php?iddasboard=MzQ4OQ==
ANY D3.JS GRAPHICS CAN BE USED ON SNAP4CITY DASHBOARDS, THE ABOVE IS ONLY A LIMITED example.
How to install d3.js support on IoT App of Snap4City on cloud and on premise.
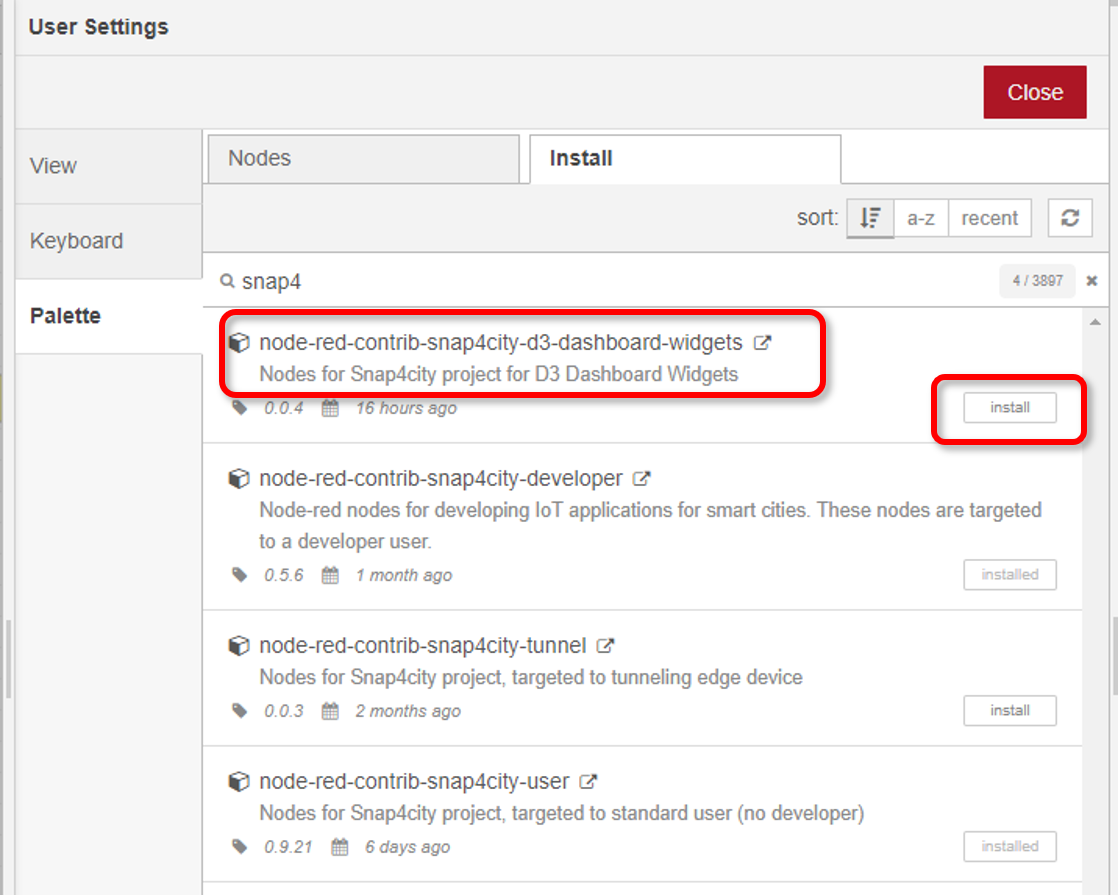
In order to install the Snap4D3 node you need to go to the Manage Palette section of Node-Red IOT App and search for the library “node-red-contrib-snap4city-d3-dashboard-widgets”. Click the install button to proceed. The node will be usable once the library has been correctly installed.
How to use it
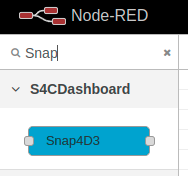
In order to use the node once the library has been installed, it is necessary to search for it manually or with the search bar on the left list of installed nodes.
The node appears under the S4CDashboard section as shown in the image below.
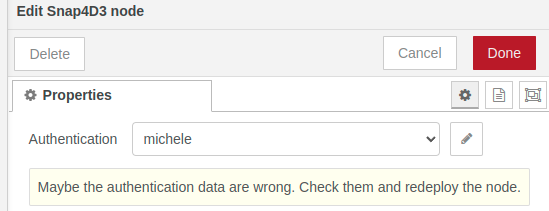
As all Snap4City dashboard nodes need authentication, you have to set this through the appropriate section by clicking twice on the node.
Snap4D3 node has two configuration methods, as shown below.
1. Configuration via the node input port
It is possible to send the D3 configuration to the node via the input port and then with the message from the previous node, as shown in the next example.
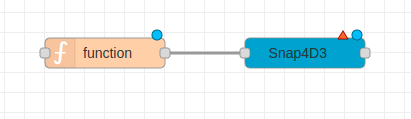
For example, we can send the configuration using the "function" node:
The following image shown how to configure the function.
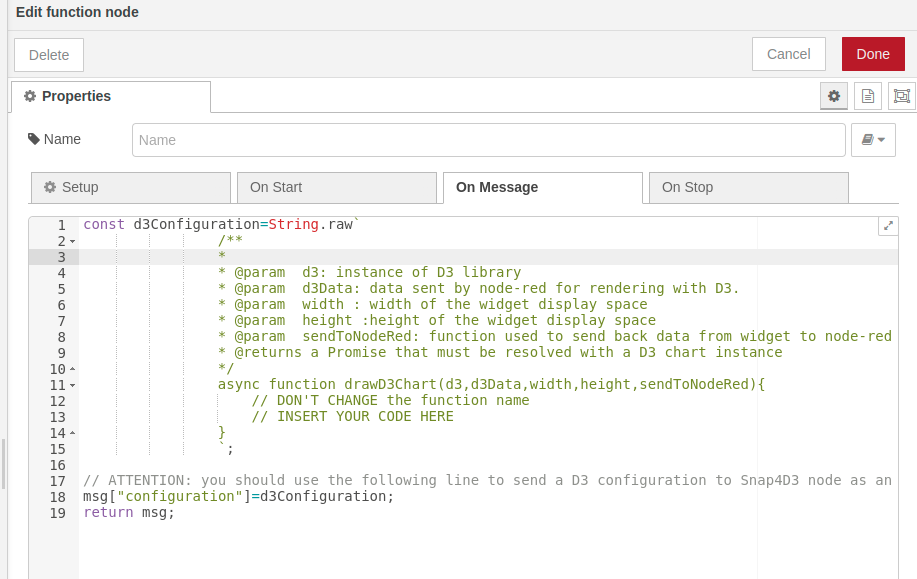
It is important to note that the name of the function “drawD3Chart” must be left as it is shown in the above image. Furthermore, this function must return a Promise that will be resolved with the html element generated by D3.js
In order to pass the configuration to Snap4D3, the message variable in which to insert the code is msg [“configuration”], msg.configuration
2. Node configuration using the appropriate field in the form
The node can also be configured with the appropriate editor under the "D3 configuration code" label, as shown in the image below.
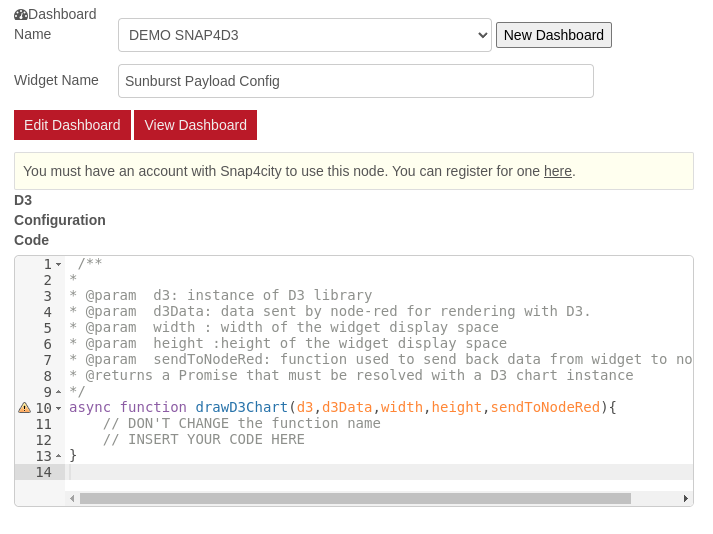
Regarding the function, please refer to what is reported in the previous section “Configuration via the node input port”.
Please, pay attention that the configuration via form does not prevail over the configuration via message to the input port. If both are present, the latter will be taken into consideration.
In addition, passing from the the code included into the node configuration text box as above to the same code passed in INPUT of the node as a JSON some changes may need to be done for still providing a valid JSON that can be intepreted as a code by the Dashboard Widget.
An example of a FLOW with several cases is accessible from https://www.snap4city.org/drupal/sites/default/files/files/2022-07-02-flusso-nesi.txt
The output port of the node conveys to the next connected node the data that the programmer believes are relevant for its application.
These data are sent via the “sendToNodeRed” function, which is an input parameter of the “drawD3Chart” function.
For example, data could be those related to clicks on certain portions on the graph.
Examples
In the following example, an IOTApplication has been created with the use of multiple Snap4D3 nodes renamed for simplify the identification.
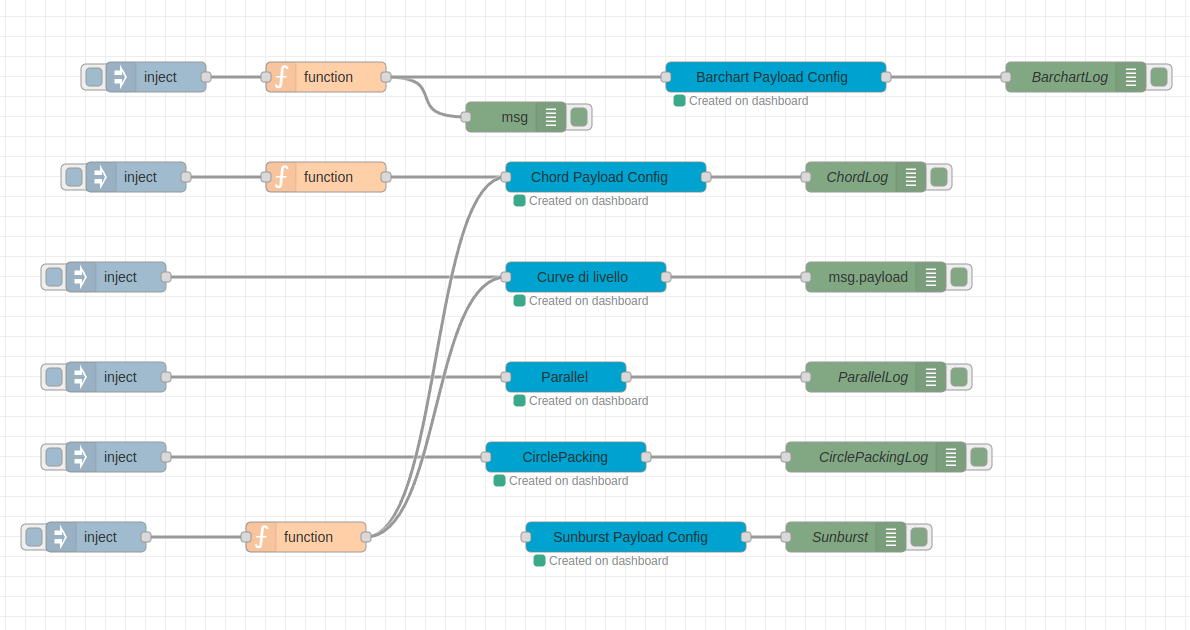
You can notice the presence or absence of the “function” blocks before the “Snap4D3” nodes, as previously mentioned, the configuration can be sent via an input message to the node.
By double clicking on the Snap4D3 node (the blue one) it is possible to select the dashboard on which to display the widget.
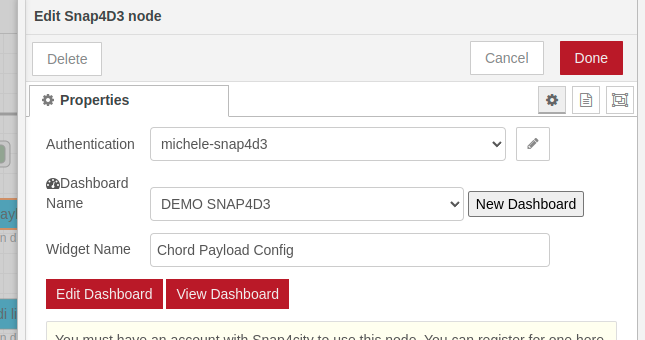
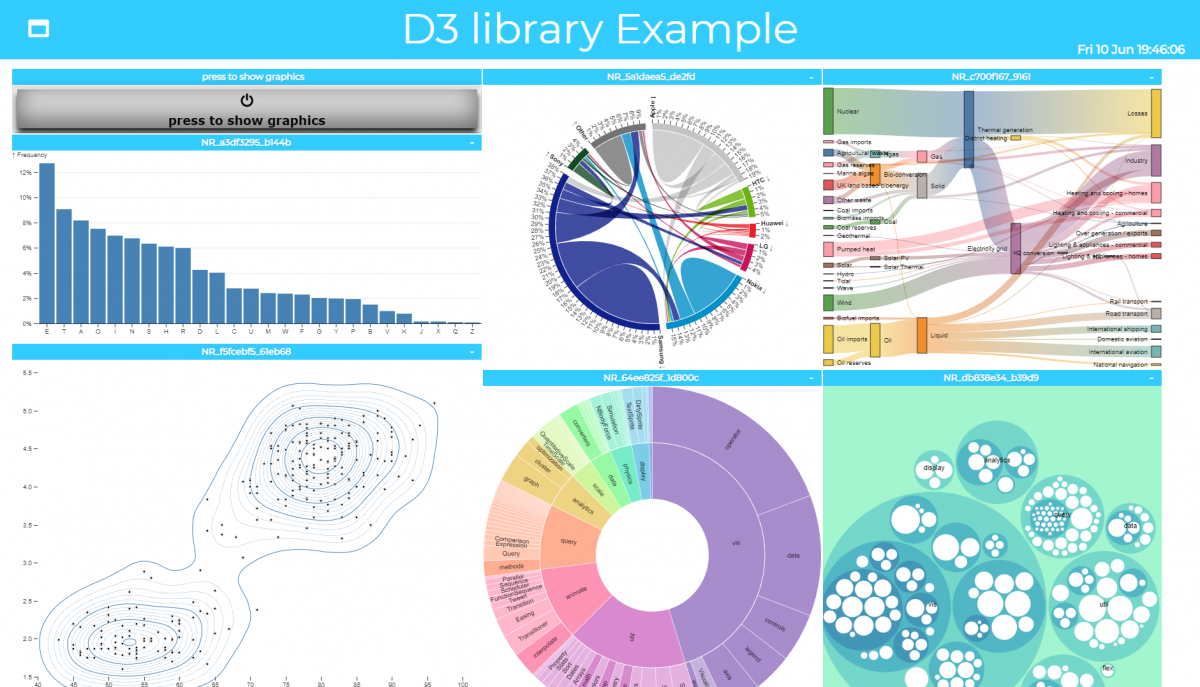
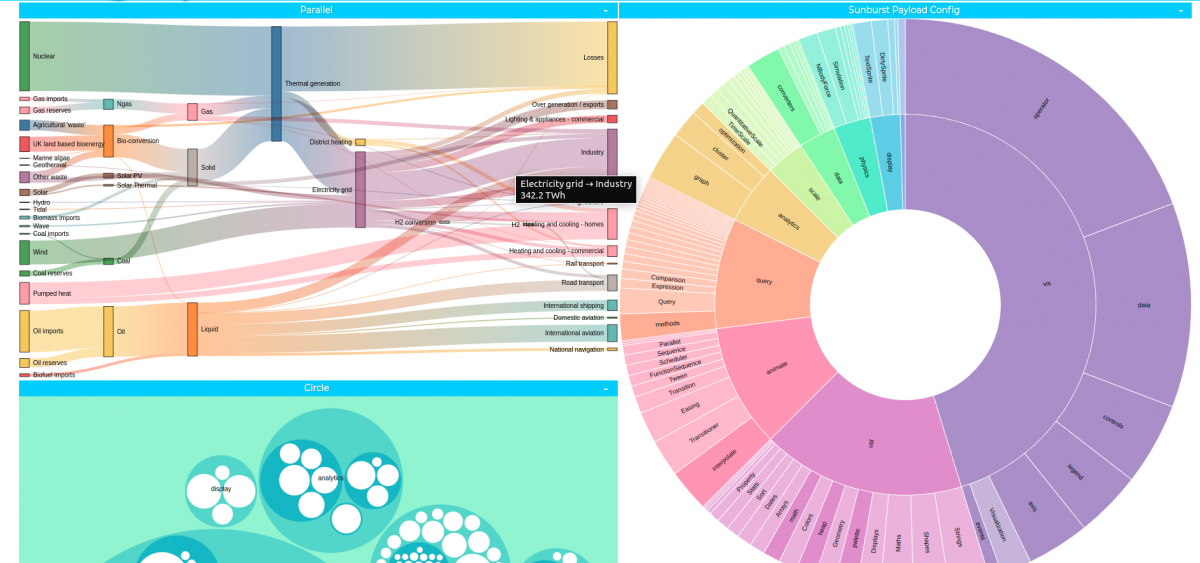
Once the dashboard has been selected, it is possible to open it using the "View Dashboard" button. In this example multiple widgets are shown in the dashboard with different graphic representations.
From the image below, which is an extract of the entirety of the dashboard in use, we can see the display of complex graphs.
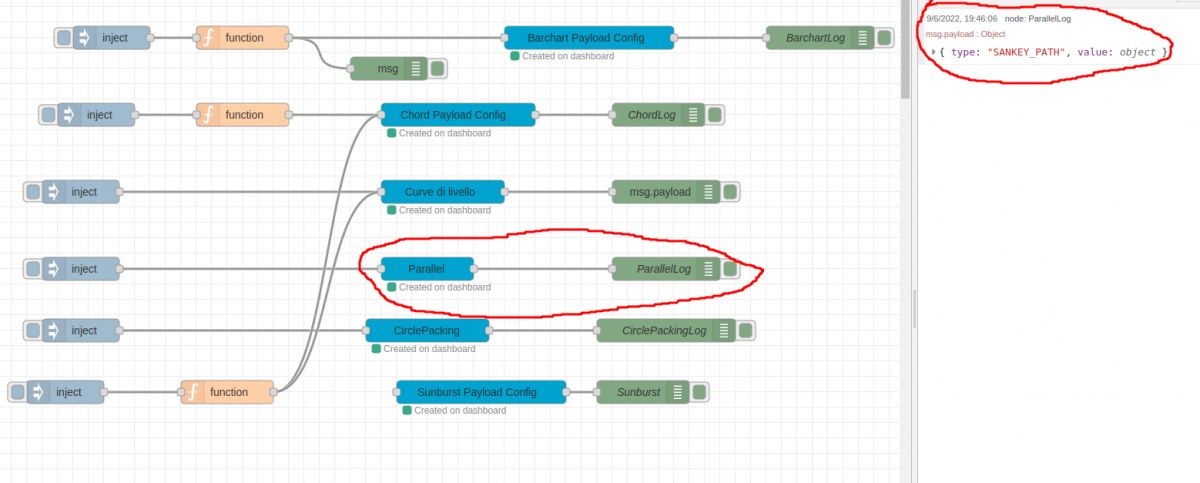
In these examples, the IOTApp is in listening for user clicks on the graphs and can then send the data of the clicked area to the Node-Red node. For example, in the next image, the user presses the part called "Thermal generation -> Losses"
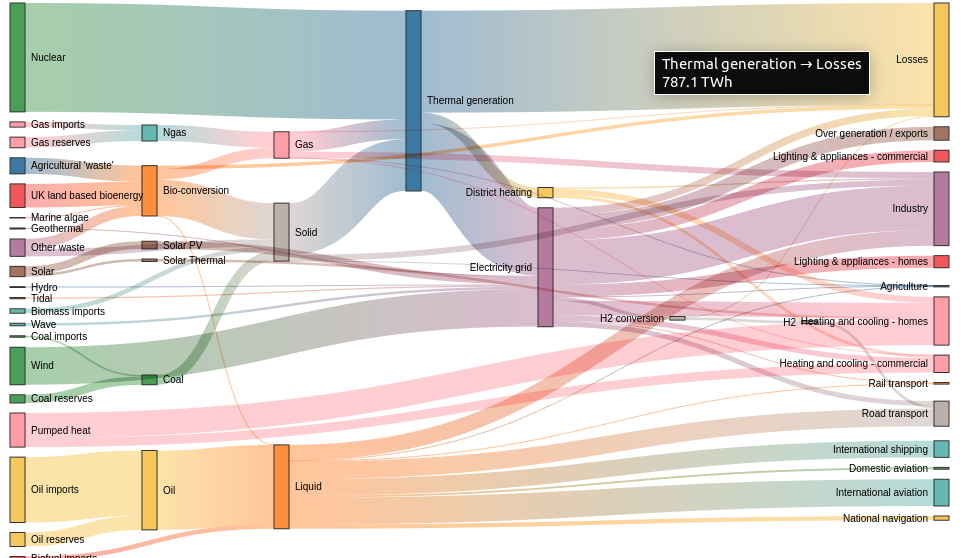
The data relating to the graph section pressed is returned by the node. In this example, the data is propagated to the debug node present in the IOTApplication, as we can see from the image below.
Parts in the flow that are involved in sending data from the widget to the node are also highlighted.
Versatility of the Snap4D3 node
As you can see from the next image, some nodes have the configuration coming from different nodes as input. This is because the Snap4D3 node is versatile and takes the configuration sent via the message on the input port, giving the programmer the possibility to draw a specific graph following certain events, using the same node and the same widget.

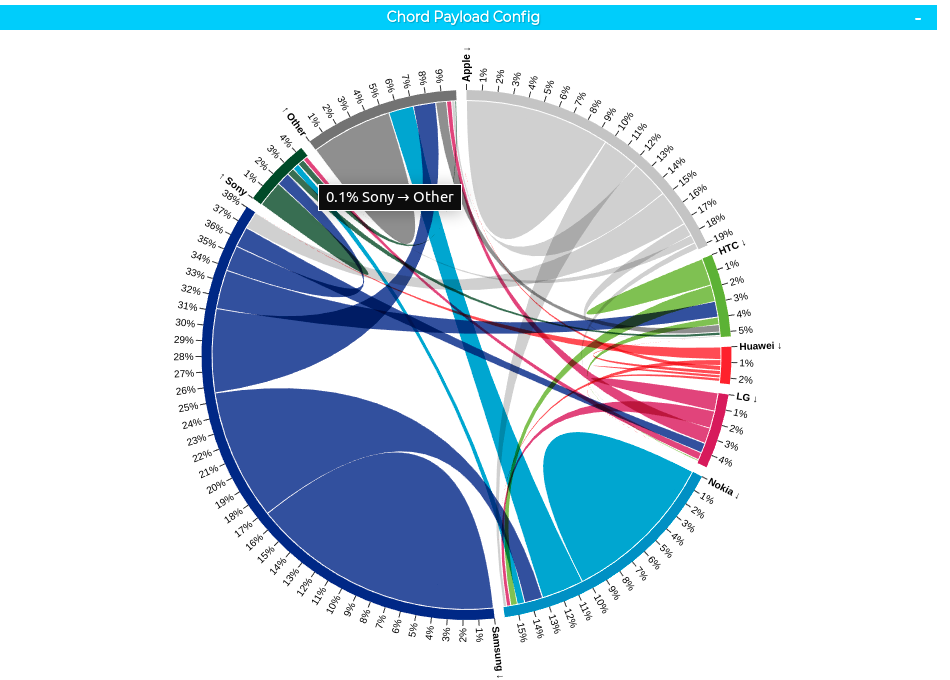
In the following image an example of the “Chord Payload Config” node and widget is shown. This result is obtained by pressing the inject node on the bottom left of the flow.
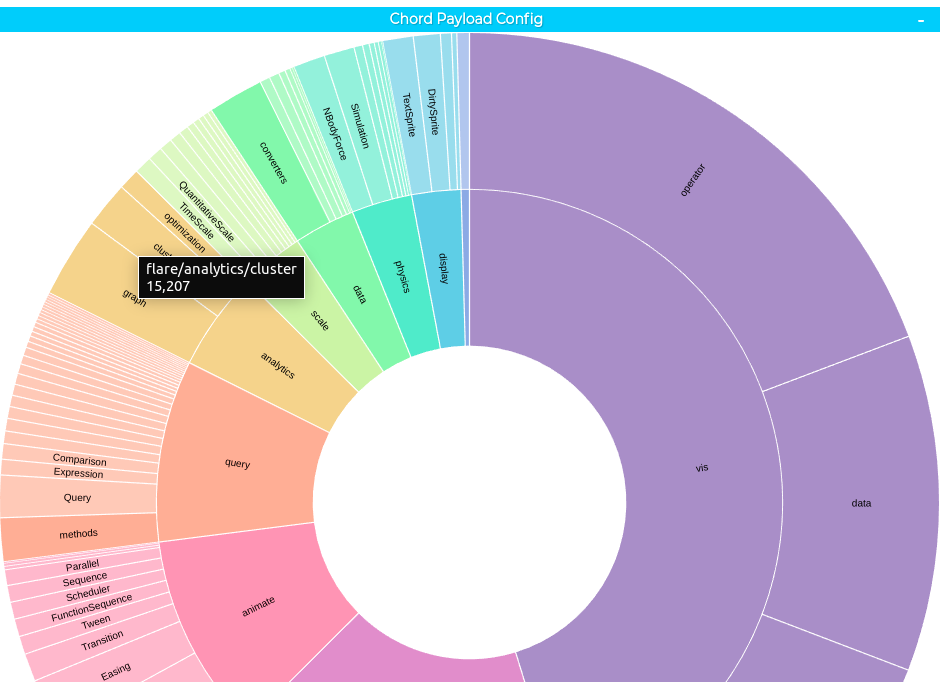
While by pressing the inject in line with the "Chord Payload Config" node, the widget draws a new type of graph, as shown below.