7. Advanced examples, usage of Smart City APIs
List of examples:
7.2 Example X: using a Business Intelligence tool
7.3 Dashboard Structure of Example X.
7.4 JavaScript on MultiDataMap of the Section 7.2 Example X: using a Business Intelligence tool
7.5 JavaScript on PieChart of the Section 7.2 Example: using a Business Intelligence tool
7.6 JavaScript on RadarSeries the Section 7.2 Example X: using a Business Intelligence tool
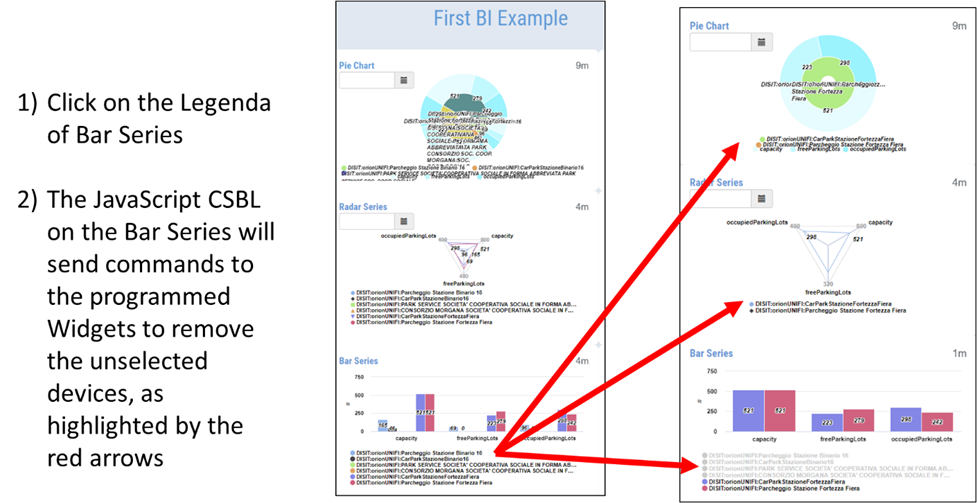
7.7 JavaScript on BarSeries of the Section 7.2 Example X: using a Business Intelligence tool
711 HTML/Javascript to build a Selector-Map scenario showing building shapes on map.
7.1 JavaScript Example for Business Intelligence: Time Drill-Down from widgetTimeTrend to widgetBarSeries
More advanced example of time drill down from widgetTimeTrend to widgetBarSeries. By zooming in the TimeTrend widget, the following Javascript function is executed, which makes a call to the Smart City API to retrieve the real-time data of the IoT Device corresponding to the Service URI sent in the parameters to the function itself.
The data received in response to the call to the API is averaged over the time range selected in the zoom (and sent as parameters to the function).
Finally, a data structure conforming to the required JSON is prepared to display the average values for each Device metric in a widgetBarSeries (specified by <TARGET_WIDGET_BAR_SERIES>).
function execute() {
let minT, maxT = null;
if (param['t1'] != param['t2']) {
minT = param['t1'];
maxT = param['t2'];
} else {
minT = param['t1']-10000000;
maxT = param['t2']+10000000;
}
let dt1 = new Date(minT);
let dt1_iso = dt1.toISOString().split(".")[0];
let dt2 = new Date(maxT);
let dt2_iso = dt2.toISOString().split(".")[0];
function getMean(originalData)
{
var singleOriginalData, singleData, convertedDate = null;
var convertedData = {
data: []
};
var originalDataWithNoTime = 0;
var originalDataNotNumeric = 0;
var meanDataObj = {};
if(originalData.hasOwnProperty("realtime"))
{
if(originalData.realtime.hasOwnProperty("results"))
{
if(originalData.realtime.results.hasOwnProperty("bindings"))
{
if(originalData.realtime.results.bindings.length > 0)
{
let propertyJson = "";
if(originalData.hasOwnProperty("BusStop"))
{
propertyJson = originalData.BusStop;
}
else
{
if(originalData.hasOwnProperty("Sensor"))
{
propertyJson = originalData.Sensor;
}
else
{
if(originalData.hasOwnProperty("Service"))
{
propertyJson = originalData.Service;
}
else
{
propertyJson = originalData.Services;
}
}
}
for(var j = 0; j < originalData.realtime.head.vars.length; j++) {
var singleObj = {}
var field = originalData.realtime.head.vars[j];
var numericCount = 0;
var sum = 0;
var mean = 0;
if (field == "updating" || field == "measuredTime" || field == "instantTime" || field == "dateObserved") {
continue;
}
for (var i = 0; i < originalData.realtime.results.bindings.length; i++) {
singleOriginalData = originalData.realtime.results.bindings[i];
if (singleOriginalData[field] !== undefined) {
if (!isNaN(parseFloat(singleOriginalData[field].value))) {
numericCount++;
sum = sum + parseFloat(singleOriginalData[field].value);
}
}
}
mean = sum / numericCount;
meanDataObj[field] = mean;
}
return meanDataObj;
} else {
return false;
}
} else {
return false;
}
} else {
return false;
}
} else {
return false;
}
}
function buildDynamicData(data, name) {
var passedJson = [];
for (const item in data) {
var singleJson = {};
singleJson["metricId"] = "";
singleJson["metricHighLevelType"] = "Dynamic";
singleJson["metricName"] = name;
singleJson["metricType"] = item;
singleJson["metricValueUnit"] = "";
singleJson["value"] = data[item];
passedJson.push(singleJson)
}
return passedJson;
}
$.ajax({
url: "../controllers/superservicemapProxy.php/api/v1/?serviceUri=" + encodeServiceUri(param['sUri']) + "&fromTime=" + dt1_iso + "&toTime=" + dt2_iso,
// url: "../controllers/superservicemapProxy.php/api/v1/?serviceUri=" + encodeServiceUri(sUri) + "&fromTime=" + dt1_iso + "&toTime=" + dt2_iso + "&valueName=" + param['metricName'],
type: "GET",
data: {},
async: true,
dataType: 'json',
success: function(data)
{
if (data.realtime.results) {
var meanData = getMean(data);
var passedJson = buildDynamicData(meanData, data.Service.features[0].properties.name);
$('body').trigger({
type: "showBarSeriesFromExternalContent_<TARGET_WIDGET_BAR_SERIES>",
eventGenerator: $(this),
targetWidget: "<TARGET_WIDGET_BAR_SERIES>",
color1: "#f22011",
color2: "#9c6b17",
widgetTitle: "Air Quality IT from Impulse Button",
passedData: passedJson
});
} else {
$('#<TARGET_WIDGET_BAR_SERIES>_chartContainer').hide();
$('#<TARGET_WIDGET_BAR_SERIES>_noDataAlert').show();
}
},
error: function (data)
{
console.log("Error downloading data from Service Map");
console.log(JSON.stringify(data));
}
});
}
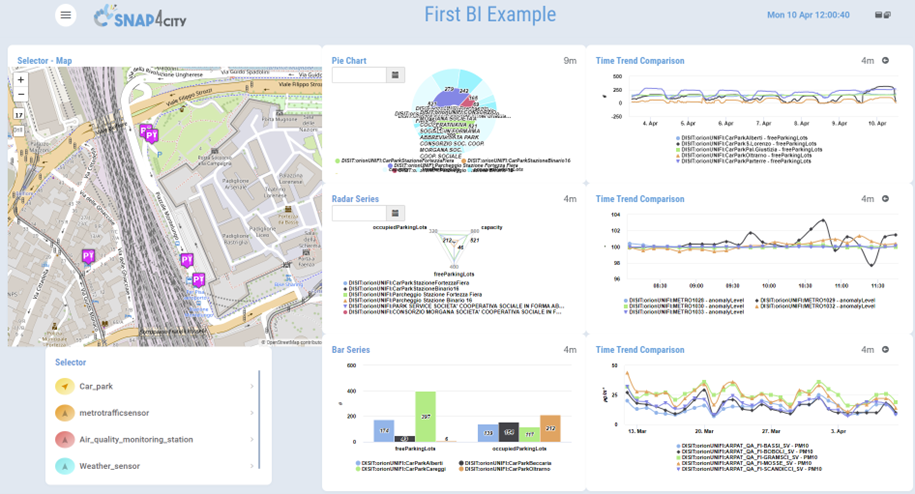
7.2 Example X: using a Business Intelligence tool
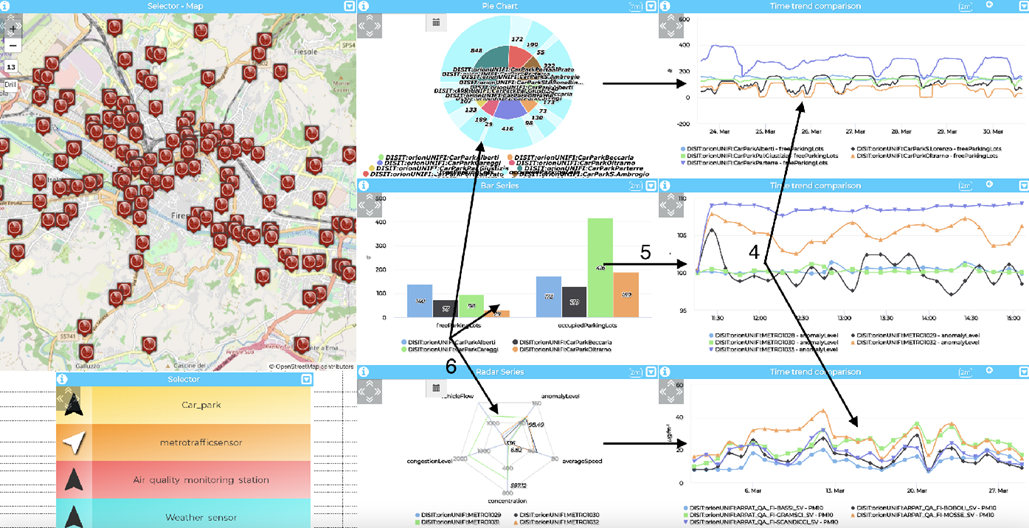
The dashboard built for demonstrating encapsulates all the functionalities in all the widgets described so far. As can be seen from Figure there is a map and its associated selector, a pie chart, a bar series, a radar series, and each of the latter three widgets is associated with a curved lines.
https://www.snap4city.org/dashboardSmartCity/view/Gea.php?iddasboard=MzcyNA==
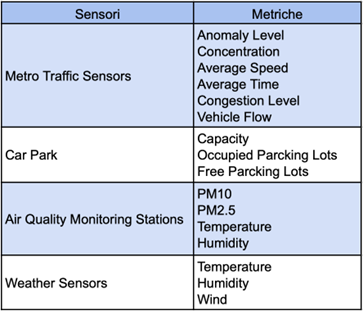
In this dashboard, it is possible to view a number of categories of sensors scattered throughout the city of Florence and beyond, with various types of metrics within:
The possible interactions with this dashboard are:
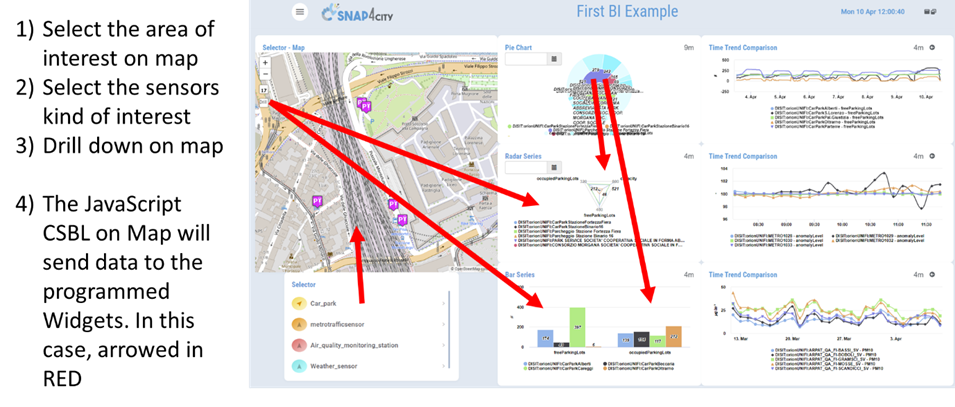
- Sensor type selection, using the selector located below the map, several different types of sensors can be selected, including traffic, parking, air quality, and weather sensors.
- Spatial Drill Down, within the map there is a button that says "drill," with this it is possible to drill down with which real time data about the sensors included by the zoom will be shown in the three widgets next to it. This allows a visualization of the usual sensors in different ways and different groupings, the pie chart groups by single sensor, while the other two by metric type.
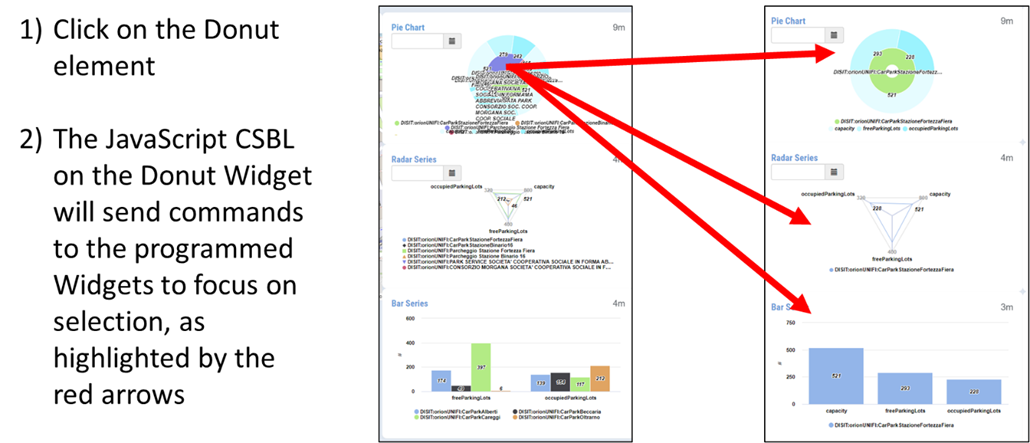
- Individual sensor selection, to analyze a single sensor of those correctly selected, a selection by marker click is possible on map or click on pie chart inner pie, both events will change the pie chart content, bar series and radar series, which will go to show only the considered sensor with all the metrics it presents.
- Drill down time , through the 3 multiple time trends it is possible to specify a time window in which to analyze the trend of the selected metrics, all three trends align at the same start and end time.
- Single metric selection, to analyze a single metric of those currently selected a selection is possible by clicking on pie chart outer pie, bar series bar or single radar series element, these events show the trend of the selected metric in a certain time range of the trend immediately adjacent to the widget with which the selection was made.
- Unselect/Select Single Sensor, in a current display of a number of sensors it is possible to unselect some of them via the bar series and radar series legend, this will "turn off" the uninterested sensors of those present removing them from display in the other widgets. If a sensor has been turned off it will still remain displayed in the legend of the widget where the shutdown occurred, colored gray, it will then be possible to "turn it back on" and allow it to be displayed in the other widgets as well.
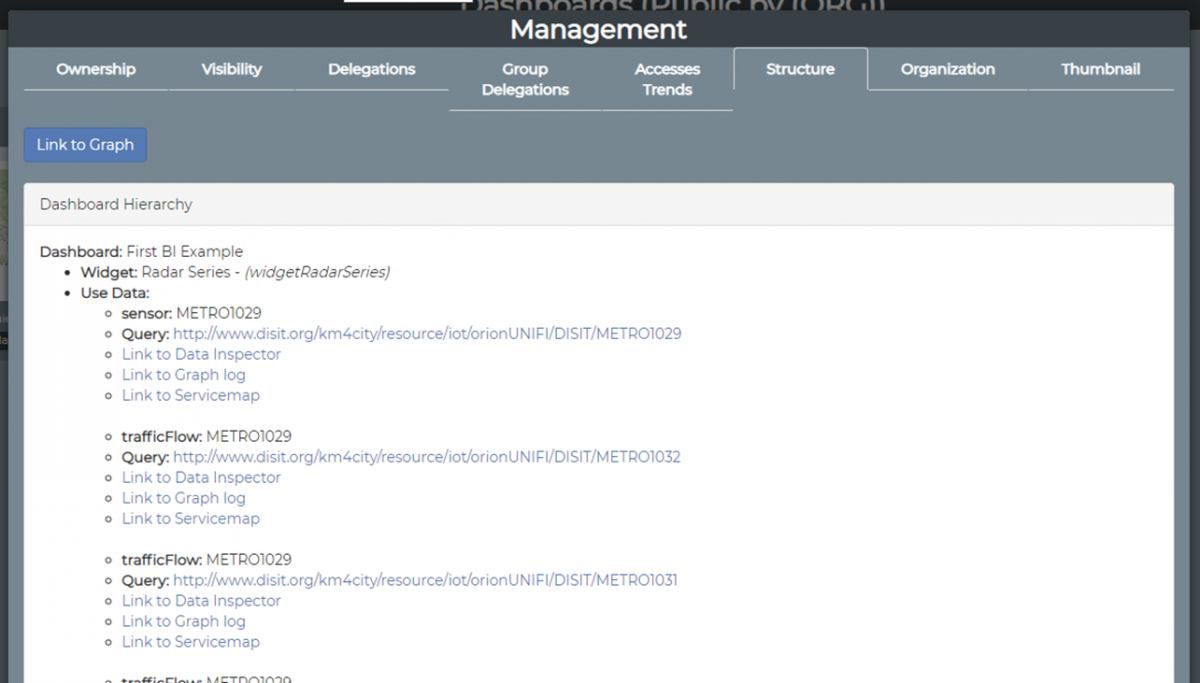
7.3 Dashboard Structure of Example X
To get the Dashboard structure enter in the dashboard preview list, select the link Management available below the dashboard of interest and click on the "Structure Tab" (as in the example below).
7.4 JavaScript on MultiDataMap of the Section 7.2 Example X: using a Business Intelligence tool
function execute(){
var e = JSON.parse(param)
sendData(e);
function buildData(e){
var carParkSensorsMetrics = ["capacity","freeParkingLots","occupiedParkingLots"];
var airQualitySensorsMetrics = ["PM10","PM2_5","CO","Benzene","NO2"];
var weatherSensorsMetrics = ["temperature", "wind", "humidity"];
var trafficSensorsMetrics = ["anomalyLevel","averageSpeed","avgTime","concentration","congestionLevel","vehicleFlow"];
var metrics;
var data = [];
let h = 0;
for (var l in e.layers) {
if(e.layers[l].tipo == "Car_park"){
metrics = carParkSensorsMetrics;
}
if(e.layers[l].tipo == "Air_quality_monitoring_station"){
metrics = airQualitySensorsMetrics;
}
if(e.layers[l].tipo == "Weather_sensor"){
metrics = weatherSensorsMetrics;
}
if(e.layers[l].tipo == "Traffic_sensor"){
metrics = trafficSensorsMetrics;
}
for(var m in metrics){
data[h] = {};
data[h].metricId = "https://servicemap.disit.org/WebAppGrafo/api/v1/?serviceUri="+ e.layers[l].serviceUri;
data[h].metricHighLevelType = "Sensor";
data[h].metricName = "DISIT:orionUNIFI:" + e.layers[l].name;
data[h].metricType = metrics[m];
if(h<60) h++;
}
}
return data;
}
function sendData(e){
let data = buildData(e);
$('body').trigger({
type: "showRadarSeriesFromExternalContent_w_AggregationSeries_3724_widgetRadarSeries35600",
eventGenerator: $(this),
targetWidget: "w_AggregationSeries_3724_widgetRadarSeries35600",
color1: "#f22011",
color2: "#9c6b17",
widgetTitle: "Air Quality IT from Impulse Button",
passedData: data
});
$('body').trigger({
type: "showPieChartFromExternalContent_w_AggregationSeries_3724_widgetPieChart35601",
eventGenerator: $(this),
targetWidget: "w_AggregationSeries_3724_widgetPieChart35601",
color1: "#f22011",
color2: "#9c6b17",
widgetTitle: "Air Quality IT from Impulse Button",
passedData: data
});
$('body').trigger({
type: "showBarSeriesFromExternalContent_w_AggregationSeries_3724_widgetBarSeries35604",
eventGenerator: $(this),
targetWidget: "w_AggregationSeries_3724_widgetBarSeries35604",
color1: "#f22011",
color2: "#9c6b17",
widgetTitle: "Air Quality IT from Impulse Button",
passedData: data
});
}
}
7.5 JavaScript on PieChart of the Section 7.2 Example: using a Business Intelligence tool
function execute() {
console.log(param)
function buildData(sensName, metricTypes){
var data = [];
let h = 0;
for (let i = 0; i < (sensName.length); i++) {
for (let j = 0; j < (metricTypes.length); j++) {
data[h] = {};
data[h].metricId = "https://servicemap.disit.org/WebAppGrafo/api/v1/?serviceUri=http://www.disit.org/km4city/resource/iot/orionUNIFI/DISIT/" + sensName[i];
data[h].metricHighLevelType = "Sensor";
data[h].metricName = "DISIT:orionUNIFI:" + sensName[i];
data[h].metricType = metricTypes[j];
h++;
}
}
return data;
}
var e = param;
let sensName = [];
let metricTypes = [];
var s;
for(let i=0; i < param.length; i++){
s = param[i].metricName.replace("DISIT:orionUNIFI:", '');
if(!sensName.includes(s)){
sensName.push(s);
}
if(!metricTypes.includes(s)){
metricTypes.push(param[i].metricType);
}
}
let data = buildData(sensName, metricTypes);
console.log(data);
if(data.length > 1){
$('body').trigger({
type: "showPieChartFromExternalContent_w_AggregationSeries_3724_widgetPieChart35601",
eventGenerator: $(this),
targetWidget: "w_AggregationSeries_3724_widgetPieChart35601",
color1: "#f22011",
color2: "#9c6b17",
widgetTitle: "Air Quality IT from Impulse Button",
passedData: data
});
$('body').trigger({
type: "showRadarSeriesFromExternalContent_w_AggregationSeries_3724_widgetRadarSeries35600",
eventGenerator: $(this),
targetWidget: "w_AggregationSeries_3724_widgetRadarSeries35600",
color1: "#f22011",
color2: "#9c6b17",
widgetTitle: "Air Quality IT from Impulse Button",
passedData: data
});
$('body').trigger({
type: "showBarSeriesFromExternalContent_w_AggregationSeries_3724_widgetBarSeries35604",
eventGenerator: $(this),
targetWidget: "w_AggregationSeries_3724_widgetBarSeries35604",
color1: "#f22011",
color2: "#9c6b17",
widgetTitle: "Air Quality IT from Impulse Button",
passedData: data
});
}
if(data.length == 1){
data = [];
data[0]={};
data[0].metricId = "http://servicemap.disit.org/WebAppGrafo/api/v1/?serviceUri=http://www.disit.org/km4city/resource/iot/orionUNIFI/DISIT/"+ e[0].metricName.slice(17, e[0].metricName.length) + "&format=json";
data[0].metricHighLevelType = "Sensor";
data[0].metricName = "DISIT:orionUNIFI:" + e[0].metricName.slice(17,e[0].metricName.length);
data[0].smField = e[0].metricType;
data[0].serviceUri = "http://www.disit.org/km4city/resource/iot/orionUNIFI/DISIT/"+ e[0].metricName.slice(17,e[0].metricName.length);
console.log(data);
$('body').trigger({
type: "showCurvedLinesFromExternalContent_w_AggregationSeries_3724_widgetCurvedLineSeries35605",
eventGenerator: $(this),
targetWidget: "w_AggregationSeries_3724_widgetCurvedLineSeries35605",
range: "7/DAY",
color1: "#9b93ed",
color2: "#231d5c",
widgetTitle: "Occupied Parking Lots (Alberti Car Park) from Impulse Button",
field: data.smField,
passedData: data,
});
}
}
7.6 JavaScript on RadarSeries the Section 7.2 Example X: using a Business Intelligence tool
function execute(){
var e = JSON.parse(param);
if(e.event == "click"){
let serviceUri = "http://www.disit.org/km4city/resource/iot/orionUNIFI/DISIT/" + e.value.metricName.slice(17,e.value.metricName.length);
var data = [];
data[0]={};
data[0].metricId = "http://servicemap.disit.org/WebAppGrafo/api/v1/?serviceUri=http://www.disit.org/km4city/resource/iot/orionUNIFI/DISIT/"+ e.value.metricName.slice(17,e.value.metricName.length) + "&format=json";
data[0].metricHighLevelType = "Sensor";
data[0].metricName = "DISIT:orionUNIFI:" + e.value.metricName.slice(17,e.value.metricName.length);
data[0].smField = e.value.metricType;
data[0].serviceUri = serviceUri;
$('body').trigger({
type: "showCurvedLinesFromExternalContent_w_AggregationSeries_3724_widgetCurvedLineSeries35609",
eventGenerator: $(this),
targetWidget: "w_AggregationSeries_3724_widgetCurvedLineSeries35609",
range: "7/DAY",
color1: "#9b93ed",
color2: "#231d5c",
widgetTitle: "Occupied Parking Lots (Alberti Car Park) from Impulse Button",
field: data.smField,
passedData: data
});
}
if(e.event == "legendItemClick"){
sendData(e);
function buildData(e){
var carParkSensorsMetrics = ["capacity","freeParkingLots","occupiedParkingLots"];
var airQualitySensorsMetrics = ["PM10","PM2_5","CO","Benzene","NO2"];
var weatherSensorsMetrics = ["temperature", "wind", "humidity"];
var trafficSensorsMetrics = ["anomalyLevel","averageSpeed","avgTime","concentration","congestionLevel","vehicleFlow"];
var metrics;
var data = [];
let h = 0;
for (var l in e.layers) {
if(e.layers[l].visible == true){
e.layers[l].name = e.layers[l].name.slice(17,e.layers[l].name.length);
if(e.layers[l].tipo == "Car_park"){
metrics = carParkSensorsMetrics;
}
if(e.layers[l].tipo == "Air_quality_monitoring_station"){
metrics = airQualitySensorsMetrics;
}
if(e.layers[l].tipo == "Weather_sensor"){
metrics = weatherSensorsMetrics;
}
if(e.layers[l].tipo == "Traffic_sensor"){
metrics = trafficSensorsMetrics;
}
for(var m in e.metrics){
data[h] = {};
data[h].metricId = "https://servicemap.disit.org/WebAppGrafo/api/v1/?serviceUri=http://www.disit.org/km4city/resource/iot/orionUNIFI/DISIT/"+ e.layers[l].name;
data[h].metricHighLevelType = "Sensor";
data[h].metricName = "DISIT:orionUNIFI:" + e.layers[l].name;
data[h].metricType = e.metrics[m];
h++;
}
}
}
console.log(data);
return data;
}
function sendData(e){
let data = buildData(e);
$('body').trigger({
type: "showBarSeriesFromExternalContent_w_AggregationSeries_3724_widgetBarSeries35604",
eventGenerator: $(this),
targetWidget: "w_AggregationSeries_3724_widgetBarSeries35604",
color1: "#f22011",
color2: "#9c6b17",
widgetTitle: "Air Quality IT from Impulse Button",
passedData: data
});
$('body').trigger({
type: "showPieChartFromExternalContent_w_AggregationSeries_3724_widgetPieChart35601",
eventGenerator: $(this),
targetWidget: "w_AggregationSeries_3724_widgetPieChart35601",
color1: "#f22011",
color2: "#9c6b17",
widgetTitle: "Air Quality IT from Impulse Button",
passedData: data
});
}
}
}
7.7 JavaScript on BarSeries of the Section 7.2 Example X: using a Business Intelligence tool
function execute(){
var e = JSON.parse(param);
console.log(e);
if(e.event == "click"){
let serviceUri = "http://www.disit.org/km4city/resource/iot/orionUNIFI/DISIT/" + e.value.metricName.slice(17,e.value.metricName.length);
let smField = e.value.metricType;
var data = [];
data[0]={};
data[0].metricId = "http://servicemap.disit.org/WebAppGrafo/api/v1/?serviceUri=http://www.disit.org/km4city/resource/iot/orionUNIFI/DISIT/"+ e.value.metricName.slice(17,e.value.metricName.length) + "&format=json";
data[0].metricHighLevelType = "Sensor";
data[0].metricName = "DISIT:orionUNIFI:" + e.value.metricName.slice(17,e.value.metricName.length);
data[0].smField = e.value.metricType;
data[0].serviceUri = serviceUri;
$('body').trigger({
type: "showCurvedLinesFromExternalContent_w_AggregationSeries_3724_widgetCurvedLineSeries35608",
eventGenerator: $(this),
targetWidget: "w_AggregationSeries_3724_widgetCurvedLineSeries35608",
range: "7/DAY",
color1: "#9b93ed",
color2: "#231d5c",
widgetTitle: "Occupied Parking Lots (Alberti Car Park) from Impulse Button",
field: data.smField,
passedData: data
});
}
if(e.event == "legendItemClick"){
sendData(e);
function buildData(e){
var carParkSensorsMetrics = ["capacity","freeParkingLots","occupiedParkingLots"];
var airQualitySensorsMetrics = ["PM10","PM2_5","CO","Benzene","NO2"];
var weatherSensorsMetrics = ["temperature", "wind", "humidity"];
var trafficSensorsMetrics = ["anomalyLevel","averageSpeed","avgTime","concentration","congestionLevel","vehicleFlow"];
var metrics;
var data = [];
let h = 0;
console.log(e);
for (var l in e.layers) {
if(e.layers[l].visible == true){
e.layers[l].name = e.layers[l].name.slice(17,e.layers[l].name.length);
if(e.layers[l].tipo == "Car_park"){
metrics = carParkSensorsMetrics;
}
if(e.layers[l].tipo == "Air_quality_monitoring_station"){
metrics = airQualitySensorsMetrics;
}
if(e.layers[l].tipo == "Weather_sensor"){
metrics = weatherSensorsMetrics;
}
if(e.layers[l].tipo == "Traffic_sensor"){
metrics = trafficSensorsMetrics;
}
for(var m in e.metrics){
data[h] = {};
data[h].metricId = "https://servicemap.disit.org/WebAppGrafo/api/v1/?serviceUri=http://www.disit.org/km4city/resource/iot/orionUNIFI/DISIT/"+ e.layers[l].name;
data[h].metricHighLevelType = "Sensor";
data[h].metricName = "DISIT:orionUNIFI:" + e.layers[l].name;
data[h].metricType = e.metrics[m];
h++;
}
}
}
return data;
}
function sendData(e){
let data = buildData(e);
$('body').trigger({
type: "showRadarSeriesFromExternalContent_w_AggregationSeries_3724_widgetRadarSeries35600",
eventGenerator: $(this),
targetWidget: "w_AggregationSeries_3724_widgetRadarSeries35600",
color1: "#f22011",
color2: "#9c6b17",
widgetTitle: "Air Quality IT from Impulse Button",
passedData: data
});
$('body').trigger({
type: "showPieChartFromExternalContent_w_AggregationSeries_3724_widgetPieChart35601",
eventGenerator: $(this),
targetWidget: "w_AggregationSeries_3724_widgetPieChart35601",
color1: "#f22011",
color2: "#9c6b17",
widgetTitle: "Air Quality IT from Impulse Button",
passedData: data
});
}
}
}
7.8 JavaScript on 1st Time trend comparison of the Section 7.2 Example X: using a Business Intelligence tool
function execute() {
var newParam = {};
newParam.t1 = param['t1'];
newParam.t2 = param['t2'];
newParam.metricName = param.series[0].smField;
newParam.sUri = param.series[0].serviceUri;
param = newParam;
let minT, maxT = null;
if (param['t1'] != param['t2']) {
minT = param['t1'];
maxT = param['t2'];
}
else {
minT = param['t1']-10000000;
maxT = param['t2']+10000000;
}
let dt1 = new Date(minT);
let dt1_iso = dt1.toISOString().split(".")[0];
let dt2 = new Date(maxT);
let dt2_iso = dt2.toISOString().split(".")[0];
$('body').trigger({
type: "showCurvedLinesFromExternalContent_w_AggregationSeries_3724_widgetCurvedLineSeries35696",
eventGenerator: $(this),
targetWidget: "w_AggregationSeries_3724_widgetCurvedLineSeries35696",
range: "7/DAY",
color1: "#9b93ed",
color2: "#231d5c",
widgetTitle: "Occupied Parking Lots (Alberti Car Park) from Impulse Button",
t1: dt1_iso,
t2: dt2_iso,
});
$('body').trigger({
type: "showCurvedLinesFromExternalContent_w_AggregationSeries_3724_widgetCurvedLineSeries35608",
eventGenerator: $(this),
targetWidget: "w_AggregationSeries_3724_widgetCurvedLineSeries35608",
range: "7/DAY",
color1: "#9b93ed",
color2: "#231d5c",
widgetTitle: "Occupied Parking Lots (Alberti Car Park) from Impulse Button",
t1: dt1_iso,
t2: dt2_iso,
});
$('body').trigger({
type: "showCurvedLinesFromExternalContent_w_AggregationSeries_3724_widgetCurvedLineSeries35609",
eventGenerator: $(this),
targetWidget: "w_AggregationSeries_3724_widgetCurvedLineSeries35609",
range: "7/DAY",
color1: "#9b93ed",
color2: "#231d5c",
widgetTitle: "Occupied Parking Lots (Alberti Car Park) from Impulse Button",
t1: dt1_iso,
t2: dt2_iso,
});
}
7.9 JavaScript on 2nd Time trend comparison of the Section 7.2 Example X: using a Business Intelligence tool
function execute() {
var newParam = {};
newParam.t1 = param['t1'];
newParam.t2 = param['t2'];
newParam.metricName = param.series[0].smField;
newParam.sUri = param.series[0].serviceUri;
param = newParam;
let minT, maxT = null;
if (param['t1'] != param['t2']) {
minT = param['t1'];
maxT = param['t2'];
}
else {
minT = param['t1']-10000000;
maxT = param['t2']+10000000;
}
let dt1 = new Date(minT);
let dt1_iso = dt1.toISOString().split(".")[0];
let dt2 = new Date(maxT);
let dt2_iso = dt2.toISOString().split(".")[0];
$('body').trigger({
type: "showCurvedLinesFromExternalContent_w_AggregationSeries_3724_widgetCurvedLineSeries35696",
eventGenerator: $(this),
targetWidget: "w_AggregationSeries_3724_widgetCurvedLineSeries35696",
range: "7/DAY",
color1: "#9b93ed",
color2: "#231d5c",
widgetTitle: "Occupied Parking Lots (Alberti Car Park) from Impulse Button",
t1: dt1_iso,
t2: dt2_iso,
});
$('body').trigger({
type: "showCurvedLinesFromExternalContent_w_AggregationSeries_3724_widgetCurvedLineSeries35608",
eventGenerator: $(this),
targetWidget: "w_AggregationSeries_3724_widgetCurvedLineSeries35608",
range: "7/DAY",
color1: "#9b93ed",
color2: "#231d5c",
widgetTitle: "Occupied Parking Lots (Alberti Car Park) from Impulse Button",
t1: dt1_iso,
t2: dt2_iso,
});
$('body').trigger({
type: "showCurvedLinesFromExternalContent_w_AggregationSeries_3724_widgetCurvedLineSeries35609",
eventGenerator: $(this),
targetWidget: "w_AggregationSeries_3724_widgetCurvedLineSeries35609",
range: "7/DAY",
color1: "#9b93ed",
color2: "#231d5c",
widgetTitle: "Occupied Parking Lots (Alberti Car Park) from Impulse Button",
t1: dt1_iso,
t2: dt2_iso,
});
}
7.10 JavaScript on 3rd Time trend comparison of the Section 7.2 Example X: using a Business Intelligence tool
function execute() {
var newParam = {};
newParam.t1 = param['t1'];
newParam.t2 = param['t2'];
newParam.metricName = param.series[0].smField;
newParam.sUri = param.series[0].serviceUri;
param = newParam;
let minT, maxT = null;
if (param['t1'] != param['t2']) {
minT = param['t1'];
maxT = param['t2'];
}
else {
minT = param['t1']-10000000;
maxT = param['t2']+10000000;
}
let dt1 = new Date(minT);
let dt1_iso = dt1.toISOString().split(".")[0];
let dt2 = new Date(maxT);
let dt2_iso = dt2.toISOString().split(".")[0];
$('body').trigger({
type: "showCurvedLinesFromExternalContent_w_AggregationSeries_3724_widgetCurvedLineSeries35696",
eventGenerator: $(this),
targetWidget: "w_AggregationSeries_3724_widgetCurvedLineSeries35696",
range: "7/DAY",
color1: "#9b93ed",
color2: "#231d5c",
widgetTitle: "Occupied Parking Lots (Alberti Car Park) from Impulse Button",
t1: dt1_iso,
t2: dt2_iso,
});
$('body').trigger({
type: "showCurvedLinesFromExternalContent_w_AggregationSeries_3724_widgetCurvedLineSeries35608",
eventGenerator: $(this),
targetWidget: "w_AggregationSeries_3724_widgetCurvedLineSeries35608",
range: "7/DAY",
color1: "#9b93ed",
color2: "#231d5c",
widgetTitle: "Occupied Parking Lots (Alberti Car Park) from Impulse Button",
t1: dt1_iso,
t2: dt2_iso,
});
$('body').trigger({
type: "showCurvedLinesFromExternalContent_w_AggregationSeries_3724_widgetCurvedLineSeries35609",
eventGenerator: $(this),
targetWidget: "w_AggregationSeries_3724_widgetCurvedLineSeries35609",
range: "7/DAY",
color1: "#9b93ed",
color2: "#231d5c",
widgetTitle: "Occupied Parking Lots (Alberti Car Park) from Impulse Button",
t1: dt1_iso,
t2: dt2_iso,
});
}
7.11 HTML/Javascript to build a Selector-Map scenario showing building shapes on map
In this example, a smart selector is built to show building shapes on a widget map. The shapes color depends on the values of the selected metrics (as described later). Provided that there has been created a specific colormap (through the ColorMap manager in the resource management tool) which should be named by concatenating the string "colormap" and the name of the specific metric (with uppercase first character).
The selector is made by exploiting CSBL inside a widgetExternalContent CK Editor. The selector interface is developed in HTML allowing, for instance, to select: (i) wether to show all the building shapes or a single building shape; (ii) which metrics use to evaluate the shapes color; (iii) wether to show an informative popup on shape click or not.
In the following code, these placeholders have been used:
<BASE_SERVICEURI_URL>: it is the base URL in the service URI representing the building virtual device (e.g.: http://www.disit.org/km4city/resource/iot/orionUNIFI/DISIT/);
<POPUP_COLOR1>, <POPUP_COLOR2>: colors (in hex or rgb code) for the informative popup on shape click (if enabled);
<TARGET_WIDGET_MAP>: id of the target widget map which show the building shapes;
<TARGET_WIDGET_SINGLE_CONTENT>,<TARGET_WIDGET_TIME_TREND>: id of the target single content and time-trend widgets (if present) to show realtime results for the selected metric from the informative popup;
<SELECTED_METRICS_ARRAY_TO_FILTER>: array of strings representing the name of the desired metrics of the virtual devices to be shown in the informative popup (if enabled);
<DEVICE_MODEL_NAME>: name of the IoT model used to generate the building devices;
<DEVICE_SUBNATURE>: subnature of the building devices, according to the snap4city dictionary;
<MAP_BOUNDS_SW_LAT>: Latitude of South-West corner of desired map Bounding Box;
<MAP_BOUNDS_SW_LNG>: Longitude of South-West corner of desired map Bounding Box;
<MAP_BOUNDS_NE_LAT>: Latitude of North-East corner of desired map Bounding Box;
<MAP_BOUNDS_NE_LNG>: Longitude of North-East corner of desired map Bounding Box
<!DOCTYPE html>
<html lang="en">
<head><script src="https://www.snap4city.org/dashboardSmartCity/js/jquery-1.10.1.min.js"></script></head>
<body><div class="form-container" style="display: flex; flex-direction: column; align-items: flex-start; font-family:arial; font-size: 16px;">
<div id="midDiv"><label for="modelInstance">All / Single Device:</label>
<select id="modelInstance">
<option value="model">All</option>
<option value="singleDevice">Single Device</option>
</select>
<div id="deviceIdDiv" style="display: none;"><br><!-- Insert deviceName for all deevices -->
<label for="deviceId">Device ID:</label>
<select id="deviceId">
<option value="building2_27B">27B</option>
<option value="building2_58A">58A</option>
<option value="building2_100">100</option>
<option value="building2_101">101</option>
<option value="building2_102">102</option>
</select>
</div>
</div><br><label id="variable" for="metric">Variable:</label><select name="metric" id="metric"><!-- Insert device metrics -->
<option value="capacity">capacity</option>
<option value="allocation">allocation</option>
<option value="occupancy" selected="selected">occupancy</option>
</select>
<label>Popup on Shape Click</label><input type="checkbox" id="popupCheckbox" checked><!—Check in order to display informative popups on marker click -->
<button type="button" id="addToMap" style="cursor:pointer;background-color: lightblue;border-radius: 6px;">Add To Map</button>
</div>
<script>
$(document).ready(function () {
$("#modelInstance").change(function(){
handleModelInstanceChange();
});
$("#popupCheckbox").change(function(){
handlePopupCheckboxChange();
});
$("#addToMap").on("click", function() {
handleAddBimShape();
});
function handleModelInstanceChange() {
var modelInstanceSelect = document.getElementById("modelInstance");
var deviceIdDiv = document.getElementById("deviceIdDiv");
if (modelInstanceSelect.value === "singleDevice") {
deviceIdDiv.style.display = "block";
} else {
deviceIdDiv.style.display = "none";
}
}
function handleAddBimShape() {
var modelInstanceSelect = document.getElementById("modelInstance");
var deviceIdSelect = document.getElementById("deviceId");
var metricSelect = document.getElementById("metric");
var popupCheckbox = document.getElementById("popupCheckbox");
var altViewMode="";
if (popupCheckbox.checked) {
altViewMode="BimShapePopup";
} else {
altViewMode="BimShape";
}
params = {
modelInstance: modelInstanceSelect.value,
deviceId: deviceIdSelect.value,
metric: metricSelect.value,
altViewMode: altViewMode
};
triggerEvent("addBimShape", params);
}
document.addEventListener("DOMContentLoaded", function() {
var metricSelect = document.getElementById("metric");
var options = metricSelect.options;
for (var i = 0; i < options.length; i++) {
if (options[i].value === "occupancyPercentage") {
options[i].selected = true;
break;
}
}
});
function triggerEvent(event, params) {
let baseServiceUri = <BASE_SERVICEURI_URL>; // e.g.: "http://www.disit.org/km4city/resource/iot/orionUNIFI/DISIT/"
let coordsAndType = {};
let method = event;
if (params.modelInstance && params.modelInstance == "singleDevice" && params.deviceId != null) {
coordsAndType.query = "../controllers/superservicemapProxy.php/api/v1/?serviceUri=" + baseServiceUri + params.deviceId;
} else {
coordsAndType.query = "../controllers/superservicemapProxy.php/api/v1/iot-search/?selection=<MAP_BOUNDS_SW_LAT>;<MAP_BOUNDS_SW_LNG>;<MAP_BOUNDS_NE_LAT>;<MAP_BOUNDS_NE_LNG>&categories=" + categories + "&format=json&maxResults=300&model=" + deviceModel;
}
coordsAndType.desc = params.metric;
coordsAndType.color1 = <POPUP_COLOR1>;
coordsAndType.color2 = <POPUP_COLOR2>;
coordsAndType.targets = <TARGET_WIDGET_SINGLE_CONTENT>,<TARGET_WIDGET_TIME_TREND>;
coordsAndType.display = "pins";
coordsAndType.queryType = "Default";
coordsAndType.iconTextMode = "text";
coordsAndType.altViewMode = params.altViewMode;
coordsAndType.bubbleSelectedMetric = params.metric;
coordsAndType.modelInstance = params.modelInstance;
let selectedMetrics = <SELECTED_METRICS_ARRAY_TO_FILTER> // e.g.: ["capacity", "allocation", "occupancy"]
coordsAndType.selectedMetrics = selectedMetrics;
parent.$('body').trigger({
type: event,
target: <TARGET_WIDGET_MAP>,
passedData: coordsAndType
});
}
console.log("Smart Selector CSBL");
var deviceModel = <DEVICE_MODEL_NAME>;
var categories = <DEVICE_SUBNATURE>;
// AUTO-START
setTimeout(function() {
handleAddBimShape();
}, 800);
});
</script>
</body>
</html>