In the context of AMPERE, an application to manage emergency sent by using a smart jewerly and a mobile App has been developed. To manage emergency messages received a specific application has been developed. The user involved in this process is the so-called Ampere Operator.
The Ampere Operator has the task of displaying and managing the alarm and QR / NFC events of the users, also generating actions such as calls on the contact numbers provided by the user.
The Operator can view the data of all users and the events connected to it.
The management is carried out through dashboards that display as widgets “external content” of the html interfaces generated through a nodered IOT app.
The nodered data is obtained through the servicemap API which extract the data from the iotdevices of the Iot context broker "orionAMPERE-UNIFI".
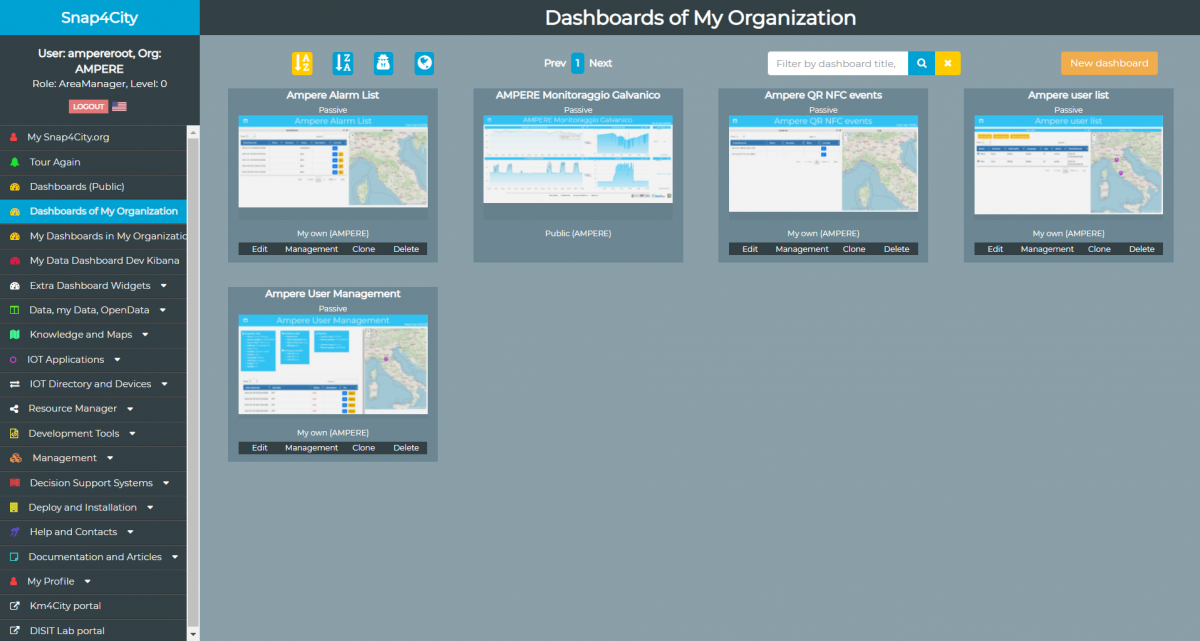
1.Dashboards
The ampere operator can view user metadata and manage alert requests through a set of dashboards.
1.1.Ampere User List
The "Ampere User List" dashboard contains a table with the list of all Ampere user profiles, which are identified by the IotDevices belonging to the "Profile" model of the "orionAMPERE-UNIFI" iot-broker.
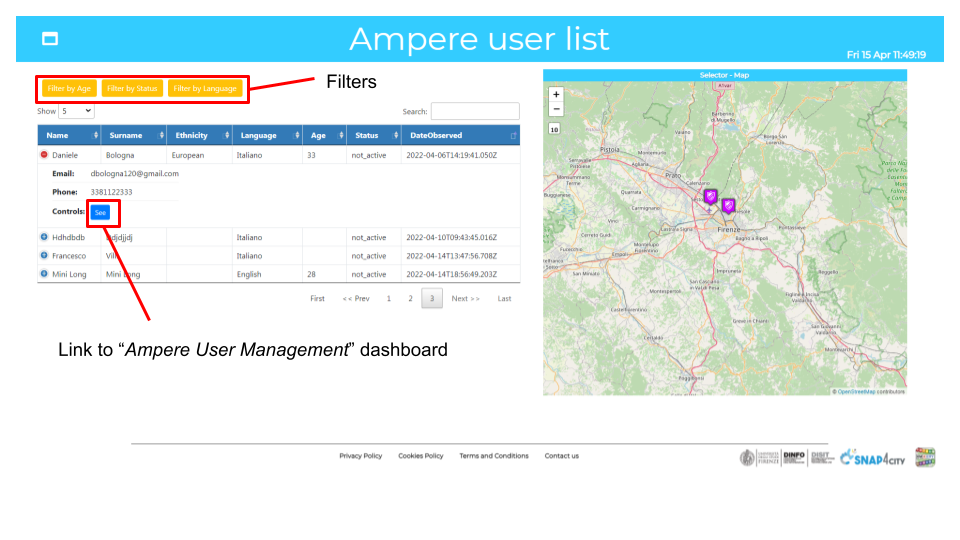
For each user, some identification metadata and a link to the "Ampere User management" dashboard are shown in the table. A Pin selector for each user is visible on the map on the right side of the screen.
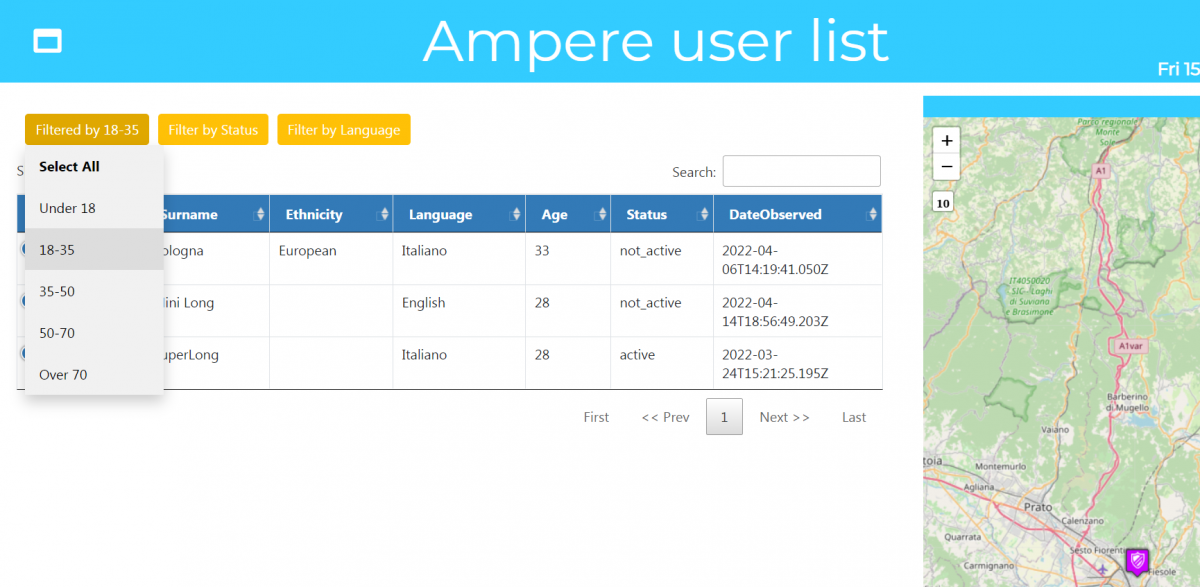
The table can be filtered based on the age of the users, on the language they have set and on the status (not_active and active).
1.2.Ampere User Management
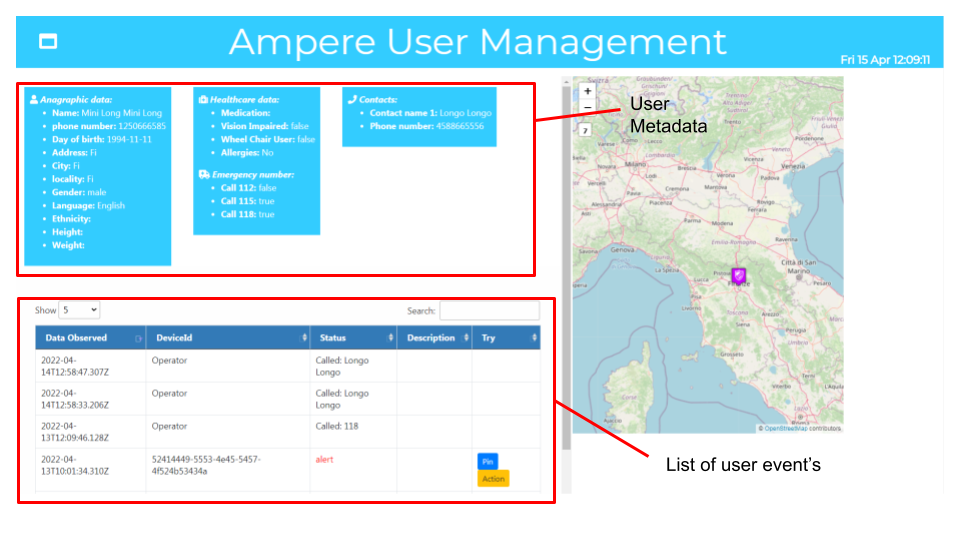
The "Ampere User Management" dashboard is used to show the metadata of the individual user and display a list of the latest activities performed by a user.
The upper part of the screen shows the data of a user (obtained from the device type "Profile" IOT device). Each user has different data and a different number of contacts.
The lower part of the screen instead shows the latest activities concerning the user, extracted through the IOT device with device type "AmpereEvent". The operator sees the alert requests generated by the user and can create an action.
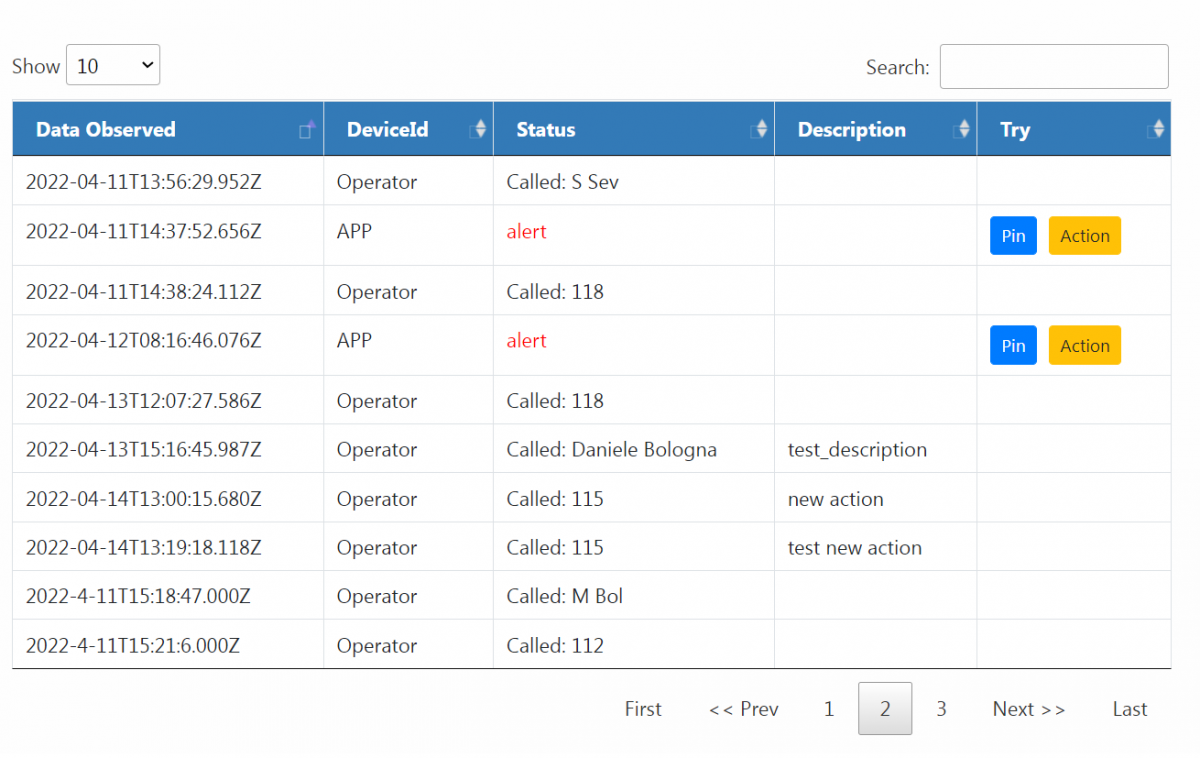 The table of events is organized as follows:
- Date Observed: event timestamp in UTC format
- Device Id: indicates the type of device that generated the event. It can be "APP" in the case of events generated by the app, be identified by the jewel code if generated by the jewel, or be labeled as "Operator" in the case of operations performed by the operator.
- Status: The Status indicates the type of event. There are less important events such as a notification on the low battery of the jewel, activities carried out by the operator and the alerts, which are indicated as being red.
- Description: It indicates a description entered by the operator when creating an action.
- Try: In the case of "alert" events, it is possible to view the location of the event on the map using the Pin button, or to create an action.
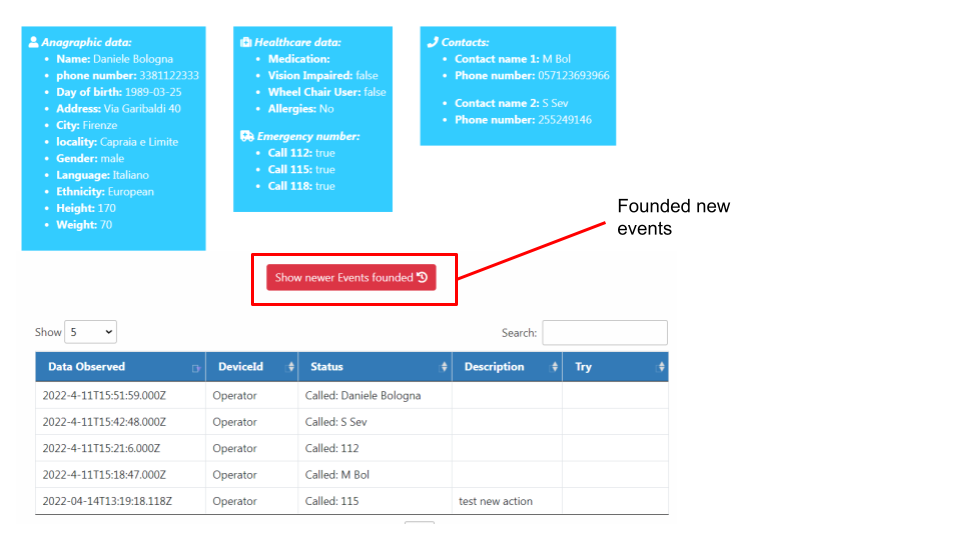
To check in real time if the user has generated new events every minute a check is performed on the iotdevice, if a new event is found a button is shown to refresh the page.
Action
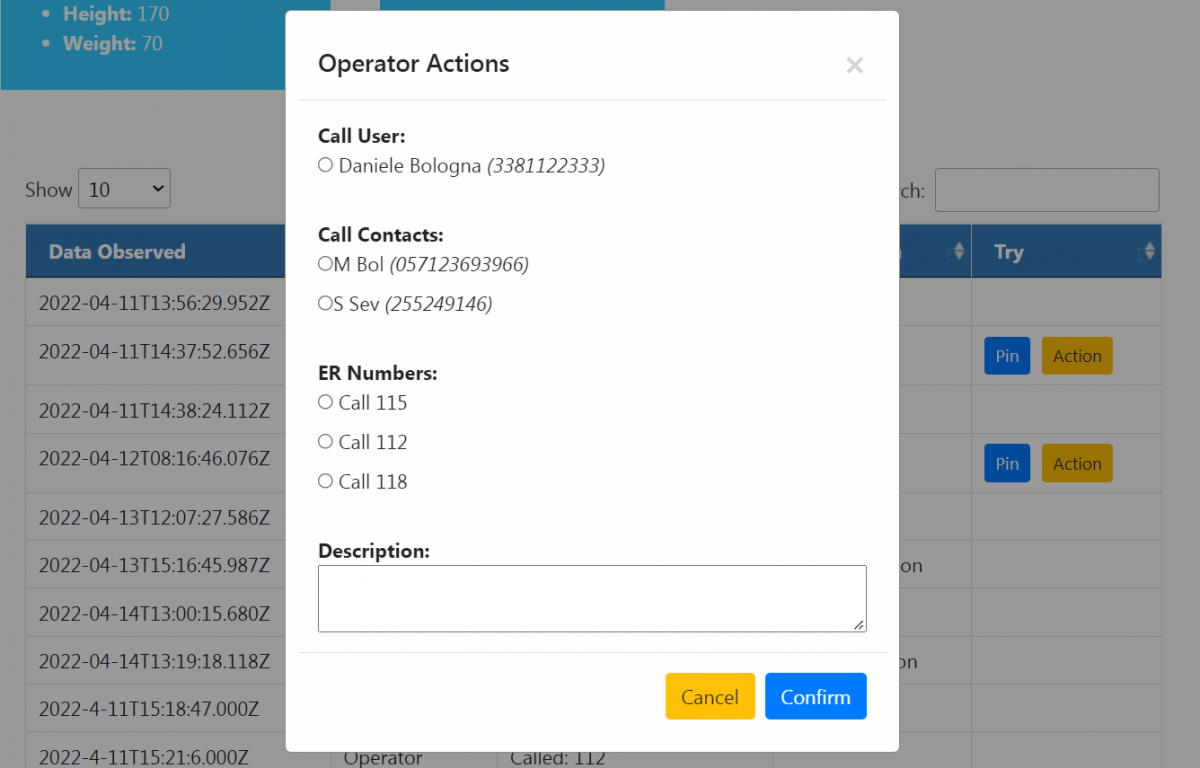
The "action" menu allows the user to notify the device of the event if the operator has made a call to the user himself, to an ER number (if the user has given permission) or to one of the contacts indicated by the user.
The operator can enter a textual description (optional) of his action.
By confirming the creation of an action, the table will be updated with the insertion of it.
The status is typically indicated with the string "Called:" followed by the name of the contact.
1.3.Ampere Alarm List
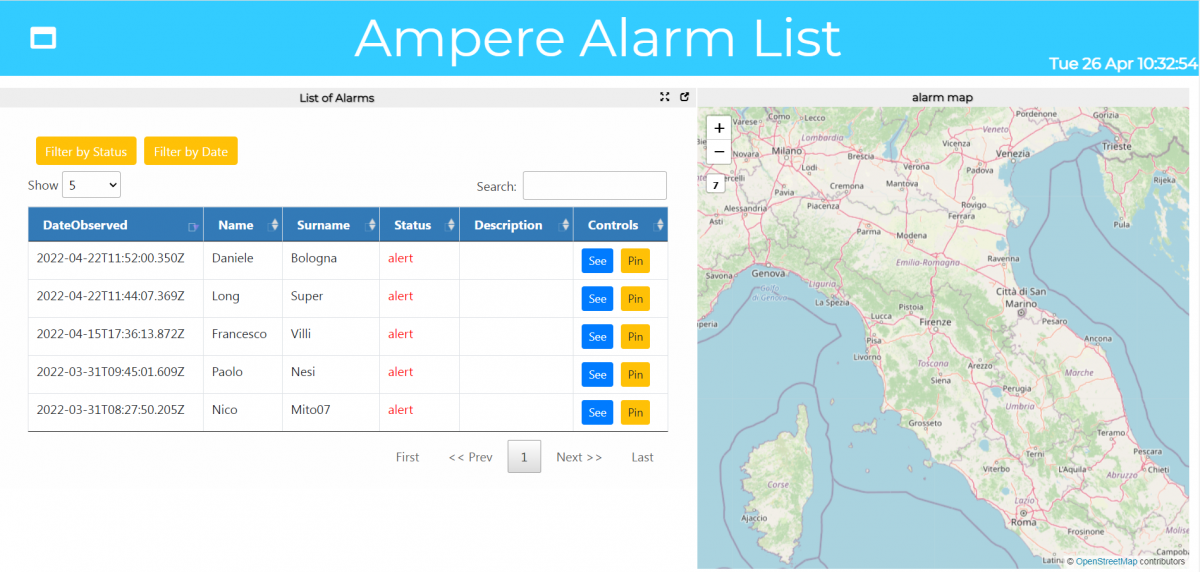
The "Ampere Alarm List" dashboard contains a complete view of the latest event from every user. Unlike the "Ampere User Management" dashboard, no actions can be performed.
Events with "Alert" status are highlighted in red for immediate recognition.
The table has a link to the "Ampere User Management" dashboard corresponding to the user by the “See” button, and a “Pin” button to visualize it on the map by a selector.

The table shows the last event of a user, and it can be changed over time. For this reason, one minute after using the dashboard, a red button appears with the label "Show New Alarms" which allows you to update the page to the current state.
It therefore allows you to view the current status of each user's events. However it will always appear even if no changes have been made.
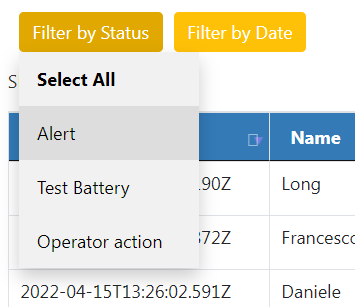
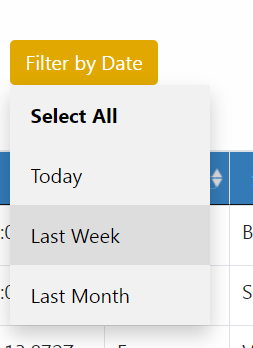
The operator can filter the list of alerts based on the status or the date of the request.
In the “Status” filter the events can be filtered as "Alert", "Test Battery" or "Operator Action".
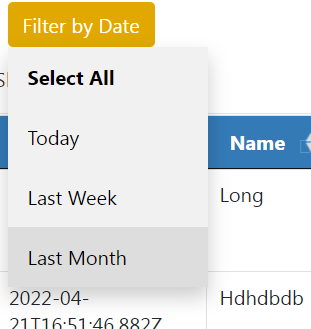
In the "Date" filter, the alert events can be filtered according to their creation date. Whether they were created today, in the past week, or in the last month.
1.4.Ampere QR NFC events
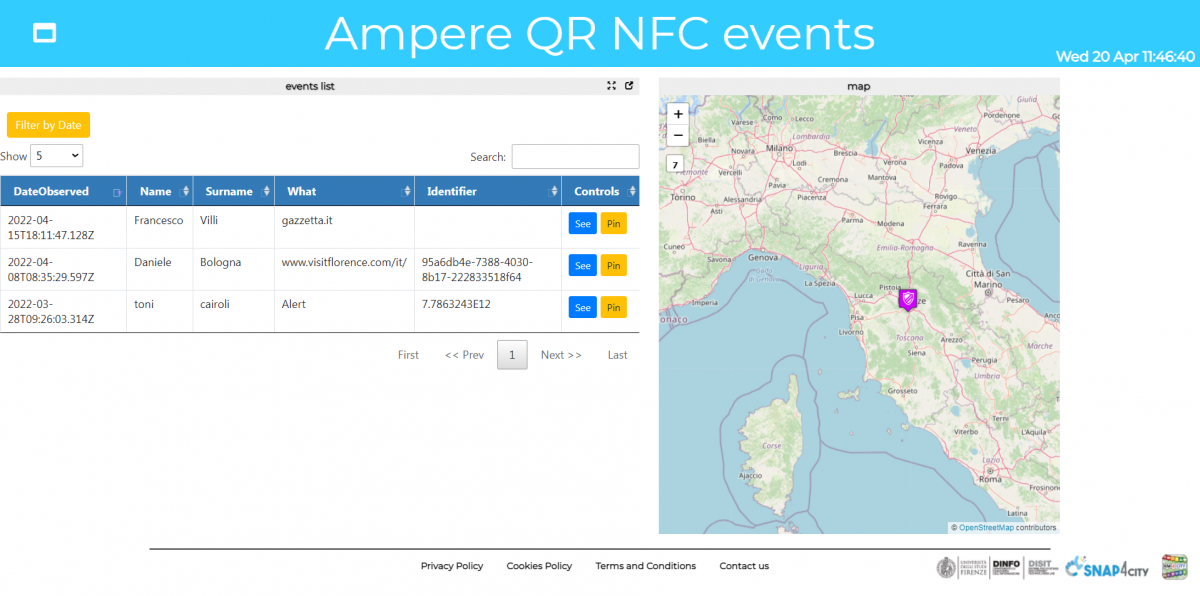
The "Ampere QR NFC events" dashboard contains a complete view of all the readings of a QR or NFC code made by all users.
The data is obtained from the iot devices belonging to the device type "QR-NFC-Event", while the data of the corresponding name are extracted from the "Profile".
Using the Pin button, it is possible to view the position of the user who made the QR / NFC request on the side map.
The table has a link to the "Ampere User Management" dashboard corresponding to the user.
In the "Date" filter, the alert events can be filtered according to their creation date. Whether they were created today, in the past week, or in the last month.