The dashboard editing/creation is simplified by the Dashboard Wizard, by which the users can create/connect dashboard widgets in a few steps, exploiting pre-build templates. Moreover, the related wizard guides users in the selection of the most appropriate widgets for displaying the data of interest, or stating from the preferred widget to identify the data which can be used for populating it, or stating from the map to identify the data which are present in the area and the widgets for their rendering, etc. The Wizard assists users by reducing complexity, providing suggestions on finding combinations between data types (time series, vectors, array, maps, trajectories, heatmaps, origin destination, point of interest, typical trends, histograms, etc.), and graphic representations (trends, multi-trends, pie, donut, maps, chords, hierarchies, solar, dendrograms, single content, Italian flag, traffic flow, 3D building, etc.). Once the editing operation has been completed, users can save the related dashboard (with the possibility to delegate it or grant access to different users) and it is made available in the dashboard collection.
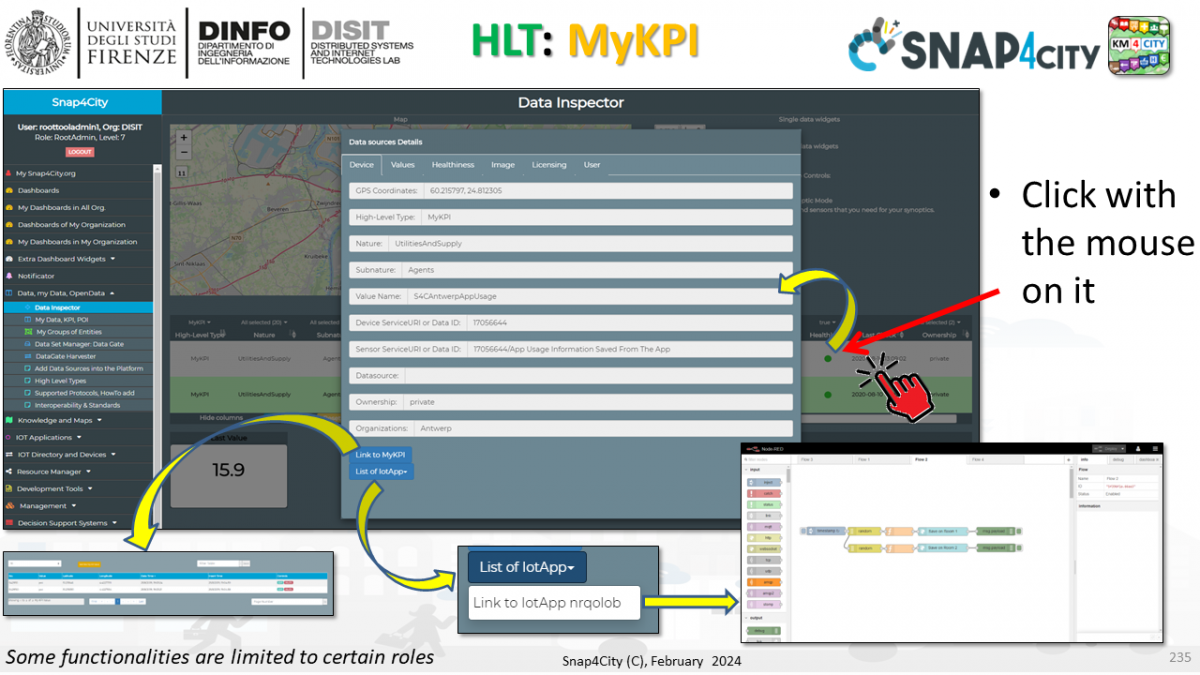
An enhanced version of the Data Inspector tools and Dashboard Wizard tool have been implemented which contains more functionalities. As shown in the following image, the new Data Inspector / Dashboard Wizard has:
- Filtering searching functionality for each individual field, even for some field non displayed as geographic coordinates
- Geographic filtering, the map is the area of the filter
- Text search on all fields, one by one or all
- View on map of the selected field, and the items selected
- Data and trend visualization of the selected field
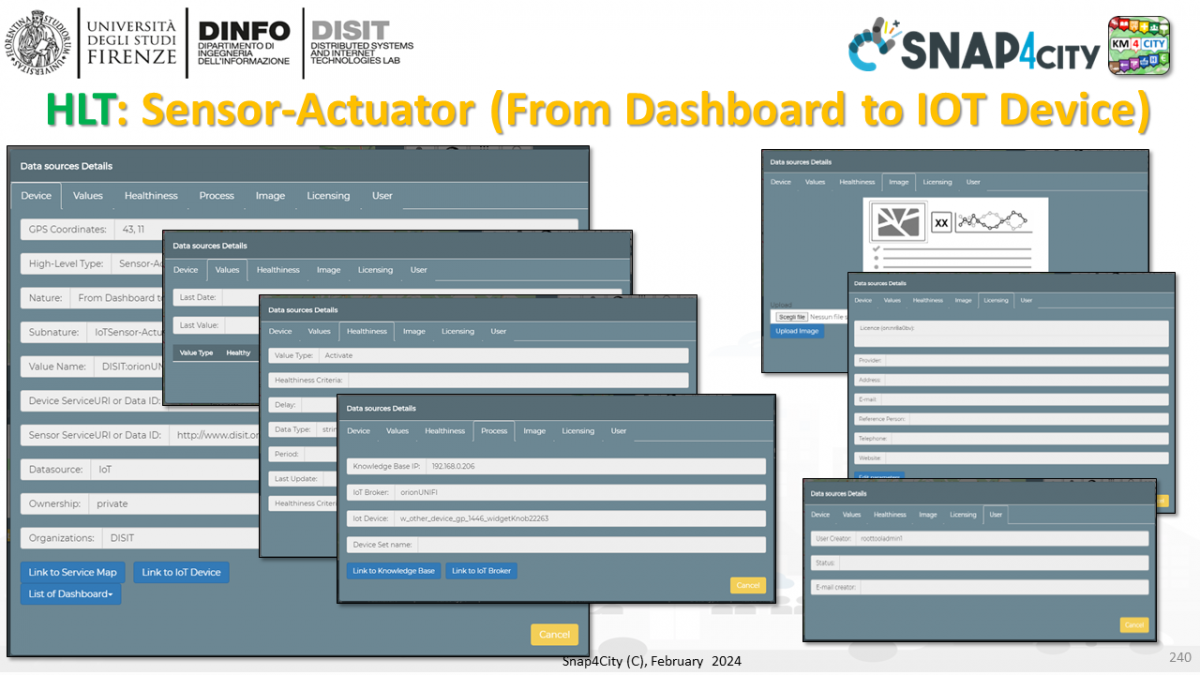
- Digital Twin view direct opening: the detailed data represention of the entities see below.
- for the 3D representation of the Digital Twin see the 3D representation
- Functionality to pass to Synoptic mode: see https://www.snap4city.org/drupal/node/651
- Carnet of available widgets to select the graphic representation of the selected data, OR to filter the data according to the graphic widget selected