click the image to access the tool (for registered users)
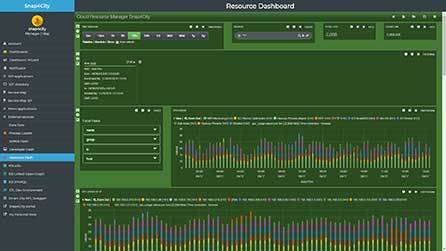
Resource Dashboard, ResDash, allows showing the real-time status and history of resources consumed in the cloud in terms of VM (Virtual Machines), Containers, Hosts. It is a simple and immediate interactive tool based on SOLR to index the data, to enable the drill down on timeline and data types, IP, etc., and thus to dynamically shape the data view according to multiple filters. It is perfect tool to identfy anomalies and understand where resources are consumed. The GUI for accessing to SOLR index is similarly to that of the Developer Dashboard and to AMMA already presented in the Snap4City suite. The Resource Monitoring Dashboard:
- is responsive, simple to be created and customized by the final user entering in the editing mode
- allow saving the dashboard on local disk and share with colleagues
- present automatic update, programmable
- can be saved/published on server, if authorized, and thus in the future on ProcessLoader.

Please note that some of the following links could be accessible only for registered users.
Resource Dashboard for Snap4City at level of VM: https://resdash.snap4city.org
- Widgets (Panel in Banana terminology) of the following kind with their usage detailed below: TIMEPICKER, QUERY, HISTOGRAM, FILTERING, HIT, FACET, TERM, TABLE
- Virtual Machines related metrics (cpu ready, cpu ready (average), cpu ready (max), cpu usage, memory shared (percentage), memory balloon (percentage), memory swapped (percentage), memory swapped, memory active (percentage), memory active, datastore IO read, datastore IO write, datastore lat read, datastore lat write, network tx, network rx, , Memory, Network, Disk, etc.);
Documentation:
- User Manual of Banana for Developers: https://www.snap4city.org/download/video/Banana_Lucidworks_User_Manual.pdf
- Step by step guide on how to create custom panels for Developers Dashbaords with commented examples: https://www.snap4city.org/download/video/CostomPanel-DeveloperDashboard.pdf
- File that can be imported in the dashboard tool as Cloud resource manager dashboard: https://www.snap4city.org/download/devdashboards/Cloud%20Resource%20Manager%20Snap4City-1518811757029