Controlling MAP data from Node-RED IOT App of Snap4City
The Selector to Map node is a microservice included in the Snap4City Node-Red library for representing entities in the multi data map widget (on dashboards) from Node-RED, such as: IoT Sensor Cateogires, POIs, single IoT Sensors, Heatmaps, MyKPI etc.
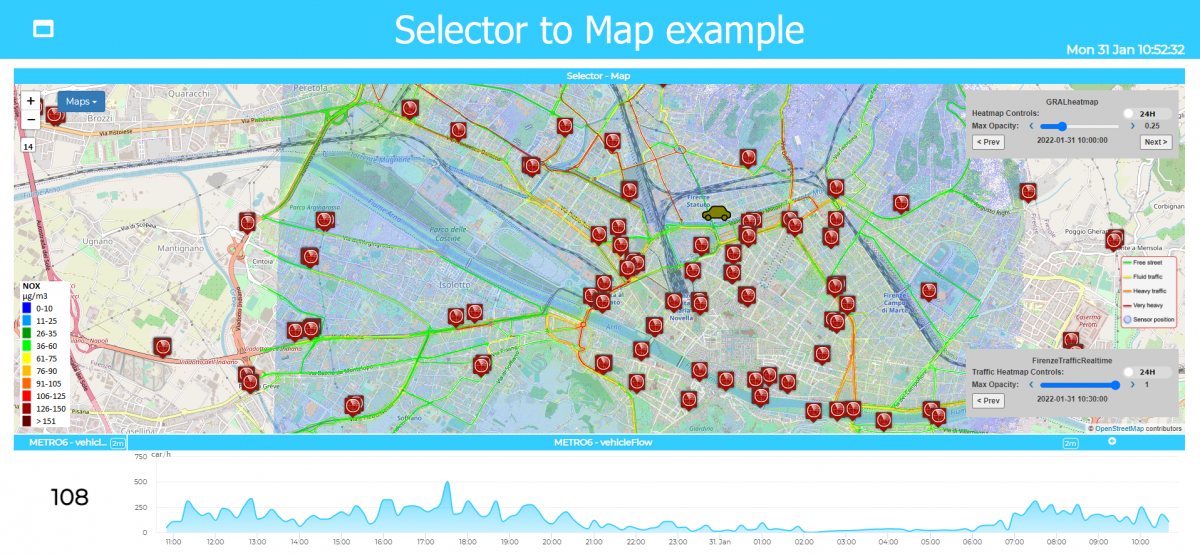
The Selector to Map node allows controlling maps from IOT Apps:
-
Add/remove a Category/SubCategory of Entities, via more option query;
-
Add/remove a single Device/PIN, MyPOI, MyKPI, Dynamic Pins, moving devices, etc.
-
Add/remove cycling paths, and garden areas;
-
Add/remove OD Matrix, Origin Destination Matrics;
-
Add/remove an Heatmaps (NO2, CO2, temparature, Humidity, incidents, noise, etc.),
-
add/remove Traffic Flows data, ...;
-
Add/remove multiple entities with multiple More Option Queries;
-
Add/remove Special Tools: scenarios, what-if analysis, etc.;
-
Add/remove a set/single temporary GeoInfoPin with HTML description for evetually opening other web pages, etc. .
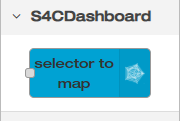
To use the SelectorMap Node-RED node in your IOT app, scroll down the S4C node list and search the node in the S4CDashboard group;
 OR THE NEW VERSION "Dashboard Map" WHICH PROVIDES ALSO OUTPUT DATA FROM THE MAP from THE SAME NODE
Drag and drop the node on the flow and double click on it to edit the node configuration. You have to specify the name of the dashboard and the name of the Map widget.
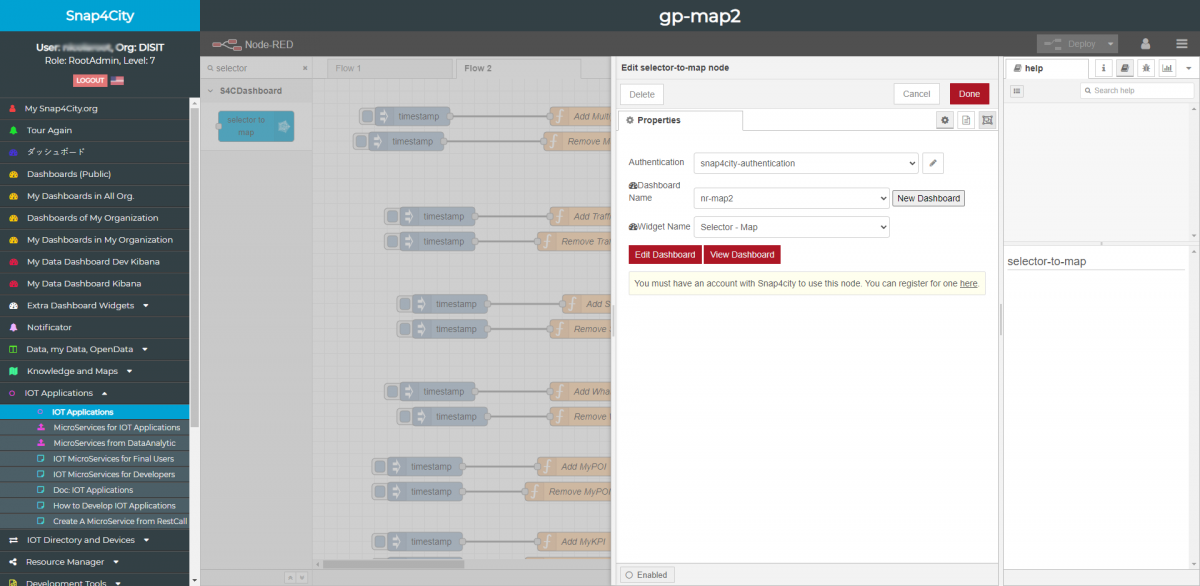
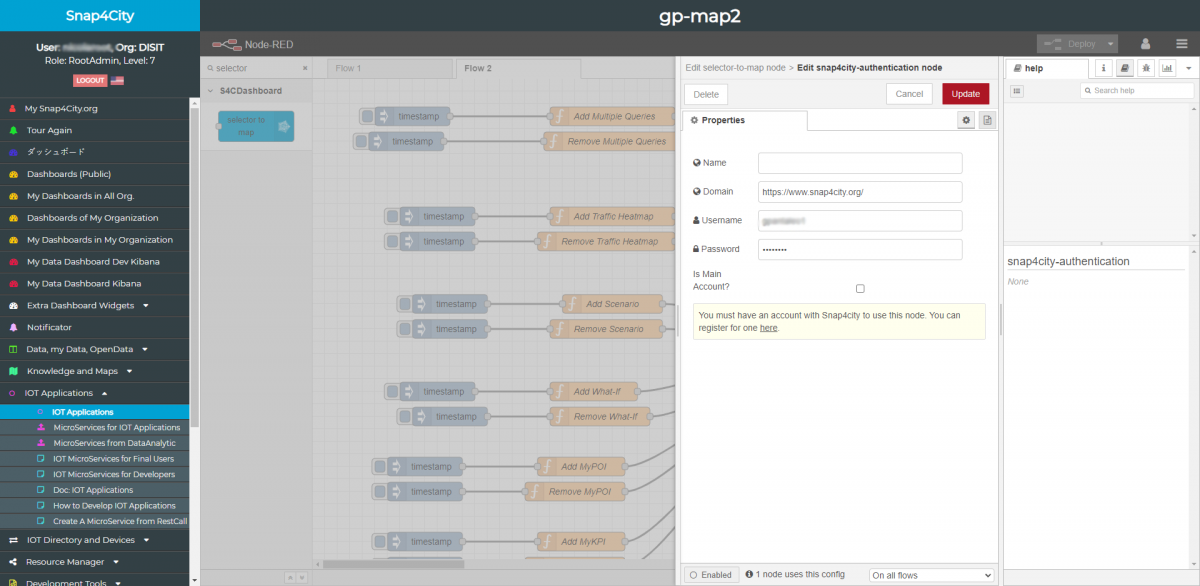
In the Authentication field click the edit button to specify the username end password of the user owner of the dashboard.
Click Done to confirm and Deploy to save the flow.
In the following examples of expected JSON with mandatory parameters are shown and explained.
Add Marker for IoT Categories and POI (addSelectorPin)
Example of expected JSON with mandatory parameters:
{
"type": "addSelectorPin",
"passedData": {
"desc": "Traffic Sensors",
"query": "https://servicemap.disit.org/WebAppGrafo/api/v1/?selection=43.74356874;11.09928131;43.81594988;11.32209777&categories=Se...",
"color1": "rgba(201,24,0,1)",
"color2": "rgba(201,24,0,0.36)",
"targets": "w_METRO588_1755_widgetTimeTrend22614",
"display": "undefined",
"queryType": "Default",
"pinattr": "square",
"pincolor": "Default",
"symbolcolor": "undefined",
"iconFilePath": "../img/widgetSelectorIconsPool/subnature/TransferServiceAndRenting_SensorSite.svg",
"altViewMode": "",
"bubbleSelectedMetric": ""
}
}
- type: (string) functionality of the multi data map widget that handles the display of the Selector object;
- passedData: (JSON string) JSON containing the typical data passed by the Selector for the visualization of Pin/Marker of IoT sensors on multi-data map; the mandatory fields are highlighted; it is also indicated if there are optional fields that have a functional inter-dependence
- desc: (string) Sensor/IoT category/POI description
- query: (string) Query to Smart City API, MyKPI or MyPOI API, etc.
- color1: (string) Primary color in the style of the pop-up generated for the data
- color2: (string) Secondary color in the style of the pop-up generated for the data
- targets: ((array of) string) Target IDs widget where trends or last values of real-time data are displayed (they are typically of the following types: widgetTimeTrend, widgetSingleContent...).
- display: (string) Map view mode. It can take the following values: ["Pins", "Geometries", "Pins and geometries", "undefined"]
- queryType: (string) query type. It can be: [“Default”, “Sensor”, “MyPOI”]:
- pinattr: (string) Pin representation mode. It can be: [“square”, “pin”]:
- square: Snap4City default marker;
- pin: custom marker (png icon created ad hoc).
- pincolor: (string) mandatory only if the value of the previous attribute "pinattr" is "pin". It represents the color of the custom pin; it can be "default" or a hexadecimal value of type "#A30B00" or also an rgb triple such as “rgb(252, 186, 3)”
- altViewMode: (string) Alternative display mode with respect to the traditional Snap4City pins or png icons; it can assume the following values: [“Bubble”, “CustomPin”, “DynamicCustomPin”]:
- bubbleSelectedMetric:(string) mandatory only if the value of the previous "altviewmode" parameter is set to “Bubble” or “CustomPin” or “DynamicCustomPin”: it represents the metric (value type) whose value is used to determine the radius of the bubbles or the parameters of the SVG for the custom Pin
- iconFIlePath: (string) The path to the icon file to represent on the map. Mandatory only if the value of the previous parameter “altViewMode” is set to “CustomPin” o “DynamicCustomPin”
- iconTextMode: (string) Selector button mode: arrow with text (“text”) or icon only (“icon”)
Example for adding POI/IoTDevice categories: Weather Sensor, displayed with traditional pin
{
"type": "addSelectorPin",
"passedData": {
"desc": "Weather_sensor", "query":"https://servicemap.disit.org/WebAppGrafo/api/v1/?selection=43.64471;11.005751;43.89471;11.505751&categories=Weather_sens...",
"color1": "rgba(51,204,51,1)",
"color2": "rgba(173,235,173,1)",
"targets": "w_METRO588_1755_widgetTimeTrend22614",
"display": "pins",
"queryType": "Default",
"pinattr": "square",
"pincolor": "Default",
"symbolcolor": "undefined",
"iconTextMode": "text"
"altViewMode": "None",
"bubbleSelectedMetric": ""
}
}
Example for adding POI/Categorie di IoTDevice: City Alerts, displayed with dynamic SVG pins
{
"type": "addBubbleChart",
"passedData": {
"desc": "Area Alerts",
"query":"https://servicemap.disit.org/WebAppGrafo/api/v1/?selection=43.73736766145917;11.195325851440431;43.801579781108180;11.33...",
"color1": "#ffdb4d",
"color2": "#fff5cc",
"targets": "w_METRO588_1755_widgetTimeTrend22614",
"display": "undefined",
"queryType": "Default",
"pinattr": "square",
"pincolor": "Default",
"symbolcolor": "undefined",
"iconFilePath": "https://www.snap4city.org/dashboardSmartCity/img/synopticTemplates/svg/140_SVG_Alert_Status.svg",
"iconTextMode": "text",
"altViewMode": "DynamicCustomPin",
"bubbleSelectedMetric": "colorcode"
}
}
Example for adding IoT Device Singolo: MyMobileDeviceTest, displayed with dynamic SVG pins
{
"type": "addBubbleChart",
"passedData": {
"desc": "DISIT:orionUNIFI:MyMobileDeviceTest",
"query":"https://servicemap.disit.org/WebAppGrafo/api/v1/?serviceUri=http://www.disit.org/km4city/resource/iot/orionUNIFI/DISIT/M...",
"color1": "#ffdb4d",
"color2": "#fff5cc",
"targets": "w_METRO588_1755_widgetTimeTrend22614",
"display": "undefined",
"queryType": "Sensor",
"pinattr": "square",
"pincolor": "#959595",
"symbolcolor": "undefined",
"iconFilePath": "https://www.snap4city.org/dashboardSmartCity/img/synopticTemplates/svg/124_SVG_car_status_in_profile.svg",
"iconTextMode": "text",
"altViewMode": "DynamicCustomPin",
"bubbleSelectedMetric": "var1"
}
}
Remove IOT Sensor Marker (removeSelectorPin)
Esempio di JSON:
{
"type": "removeSelectorPin",
"passedData": {
"desc": "Traffic Sensors",
"query": "https://servicemap.disit.org/WebAppGrafo/api/v1/?selection=43.64471;11.005751;43.89471;11.505751&categories=SensorSite&m...",
"color1": "#ffdb4d",
"color2": "#fff5cc",
"targets": "w_METRO19_2748_widgetSingleContent26687,w_METRO19_2748_widgetTimeTrend26688",
"display": "pins"
}
}
See the parameter documentation in the previous section Adding IoT Sensor Markers (addSelectorPin), they are the same.
Add Heatmap (addHeatmap)
Example of expected JSON with mandatory parameters:
{
"type": "addHeatmap",
"passedData": "https://wmsserver.snap4city.org/geoserver/Snap4City/wms?service=WMS&layers=GRALheatmap",
"passedParams": {
"desc": "GRAL Heatmap",
"color1": "rgba(0,179,61,0)",
"color2": "rgba(114,235,133,1)"
}
}
-
type: (string) functionality of the multi data map widget that handles the display of the Selector object;
-
target: (string) ID of the Target Widget of the passed event (it is the ID of the multi data map widget where you want to send the event).
-
passedData: (string) URL of the geoserver/heatmap server to find the heatmap data to display.
-
passedParams: (JSON string) Additional parameters (mandatory fields are highlighted):
-
desc: (string) Description of the Heatmap
-
color1: (string) Primary color for the style of the pop-up generated for the data
-
color2: (string) Secondary color for the style of the pop-up generated for the data
-
Remove Heatmap (removeHeatmap)
Example of expected JSON with mandatory parameters:
{
"type": "removeHeatmap",
"isTrafficHeatmap": false
}
-
type: (string) functionality of the multi data map widget that handles the display of the Selector object;
-
target: (string) ID of the Target Widget of the passed event (it is the ID of the multi data map widget where you want to send the event).
-
isTrafficHeatmap: (boolean) true if it is a traffic heatmap, false if it is a surface heatmap.
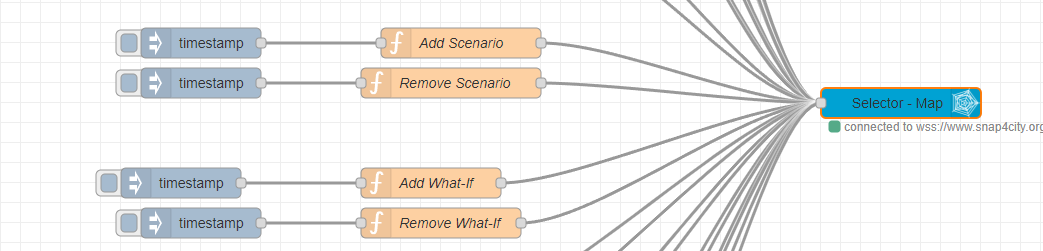
Add What-If Scenario (addScenario)
JSON Example:
{
"type": "addScenario"
}
Remove What-If Scenario (removeScenario)
JSON Example:
{
"type": "removeScenario"
}
Add What-If (addWhatif)
JSON Example:
{
"type": " addWhatif"
}
Remove What-If (removeWhatif)
JSON Example:
{
"type": " removeWhatif"
}
Add MyPOI
{
"type": "addSelectorPin",
"passedData": {
"desc": "La Bottega di Morello",
"query": "datamanager/api/v1/poidata/17055881",
"color1": "#00e6e6",
"color2": "#99ffff",
"display": "pins",
"queryType": "MyPOI",
"pinattr": "square",
"pincolor": "#959595",
"symbolcolor": "undefined",
"iconTextMode": "text"
"altViewMode": "None",
"bubbleSelectedMetric": ""
}
}
Remove MyPOI
{
"type": "removeSelectorPin",
"passedData": {
"desc": "La Bottega di Morello",
"query": "datamanager/api/v1/poidata/17055881",
"color1": "#00e6e6",
"color2": "#99ffff",
"targets": "[]",
"display": "pins"
}
}
Add MyKPI
{
"type": "addSelectorPin",
"passedData": {
"desc": "my studio temperature - GP -",
"query": "datamanager/api/v1/poidata/17055853",
"color1": "#ffdb4d",
"color2": "#fff5cc",
"display": "pins",
"queryType": "MyPOI",
"pinattr": "square",
"pincolor": "#959595",
"symbolcolor": "undefined",
"iconTextMode": "text",
"altViewMode": "None",
"bubbleSelectedMetric": ""
}
}
Remove MyKPI
{
"type": "removeSelectorPin",
"passedData": {
"desc": "my studio temperature - GP -",
"query": "datamanager/api/v1/poidata/17055853",
"color1": "#ffdb4d ",
"color2": "#fff5cc ",
"display": "pins"
}
}
Add Polylines
{
"type": "addSelectorPin",
"passedData": {
"desc": "Cycling Paths",
"query":"https://servicemap.disit.org/WebAppGrafo/api/v1/?queryId=10916300fca38e05e03096daa0418a13&format=json",
"color1": "rgba(242,208,156,1)",
"color2": "rgba(255,245,204,1)",
"display": "geometries",
"queryType": "Default",
"pinattr": "square",
"pincolor": "Default",
"symbolcolor": "undefined",
"iconTextMode": "text",
"altViewMode": "None",
"bubbleSelectedMetric": "colorcode"
}
}
Remove Polylines
{
"type": "removeSelectorPin",
"passedData": {
"desc": "Cycling Paths",
"query": "https://servicemap.disit.org/WebAppGrafo/api/v1/?queryId=10916300fca38e05e03096daa0418a13&format=json",
"color1": "rgba(242,208,156,1)",
"color2": "rgba(255,245,204,1)",
"display": "geometries"
}
}
Add OD Matrix
{
"type": "addOD",
"passedData" : "https://odmm.snap4city.org/api/get?precision=communes&from_date=2017-10-19%2000:00:00&organization=Tuscany&inflow=True&l...",
"passedParams": {
"desc": "OD Matrix Toscana",
"color1": "rgba(172,82,254,1)",
"color2": "rgba(172,82,254,0.46)",
}
}
Remove OD Matrix
{
"type": "removeOD"
}
Add GeoInfo Pin
{
"type": "addGeoInfoPin",
"passedData": [{
"id": "GeoInfoPin-01",
"eventType": "GeoInfoPin",
"textHtml": "<b>Title</b><br>Text Info.<br><br><a href='http://www.disit.org/' target='_blank'>DISIT Lab</a>",
"lat": " 43.76950",
"lng": "11.125835"
}]
}
Remove GeoInfo Pin
{
"type": "removeGeoInfoPin",
"passedData": [{
""id": "GeoInfoPin-01",
"eventType": "GeoInfoPin",
"lat": " 43.76950",
"lng": "11.125835"
}]
}
Add Array of Queries
[{
"type": "addSelectorPin",
"passedData": {
"desc": "Traffic Sensors",
"query": "https:\/\/servicemap.disit.org\/WebAppGrafo\/api\/v1\/?selection=43.64471;11.005751;43.89471;11.505751&categories=SensorSite&maxResults=200&format=json",
"color1": "#a60d0d",
"color2": "#ff9191",
"display": "pins",
"queryType": "Default",
"pinattr": "square",
"pincolor": "Default",
"symbolcolor": "undefined",
"iconTextMode": "text",
"altViewMode": "None",
"bubbleSelectedMetric": ""
}
}, {
"type": "addBubbleChart",
"passedData": {
"desc": "DISIT:orionUNIFI:MyMobileDeviceTest",
"query": "https:\/\/servicemap.disit.org\/WebAppGrafo\/api\/v1\/?serviceUri=http:\/\/www.disit.org\/km4city\/resource\/iot\/orionUNIFI\/DISIT\/MyMobileDeviceTest&format=json&fromTime=3-day",
"color1": "#ffdb4d",
"color2": "#fff5cc",
"display": "undefined",
"queryType": "Sensor",
"pinattr": "square",
"pincolor": "#959595",
"symbolcolor": "undefined",
"iconFilePath": "https:\/\/www.snap4city.org\/dashboardSmartCity\/img\/synopticTemplates\/svg\/124_SVG_car_status_in_profile.svg",
"iconTextMode": "text",
"altViewMode": "DynamicCustomPin",
"bubbleSelectedMetric": "var1"
}
}, {
"type": "addHeatmap",
"passedData": "https:\/\/wmsserver.snap4city.org\/geoserver\/Snap4City\/wms?service=WMS&layers=GRALheatmap",
"passedParams": {
"desc": "GRAL Heatmap",
"color1": "rgba(0,179,61,0)",
"color2": "rgba(114,235,133,1)"
}
}]
Remove Array of Queries (related to previous example)
[{
"type": "removeSelectorPin",
"passedData": {
"desc": "Traffic Sensors",
"query": "https:\/\/servicemap.disit.org\/WebAppGrafo\/api\/v1\/?selection=43.64471;11.005751;43.89471;11.505751&categories=SensorSite&maxResults=200&format=json",
"color1": "#a60d0d",
"color2": "#ff9191",
"display": "pins"
}
}, {
"type": "removeSelectorPin",
"passedData": {
"desc": "DISIT:orionUNIFI:MyMobileDeviceTest",
"query": "https:\/\/servicemap.disit.org\/WebAppGrafo\/api\/v1\/?selection=43.73736766145917;11.195325851440431;43.801579781108180;11.331195831298830&categories=Civil_registry&maxResults=200&format=json",
"color1": "#ffdb4d",
"color2": "#fff5cc",
"display": "pins"
}
}, {
"type": "removeHeatmap",
"isTrafficHeatmap": false
}]